
- Litecoin price is currently contained inside a symmetrical triangle pattern on the 1-hour chart.
- The pattern is on the verge of a breakout above $200, favored by technicals.
- Whales have bought a lot of Litecoin in the past three days.
Litecoin price topped out at $193 and was unable to crack the previous high of $195. The digital asset is trading inside a tightening range and it’s on the verge of a 15% move, most likely to the upside according to various indicators.
Litecoin price is on the brink of reaching $220
Litecoin has established a symmetrical triangle pattern on the 1-hour chart and it’s on the verge of a breakout. Cracking the resistance level at $190 would quickly push Litecoin price towards $220, which is a 15% move, calculated by using the height of the pattern.
LTC/USD 1-hour chart
The In/Out of the Money Around Price (IOMAP) chart shows practically no significant barriers on the way up above $185. There is, however, a lot of support below $185 which means bulls have the upper hand.
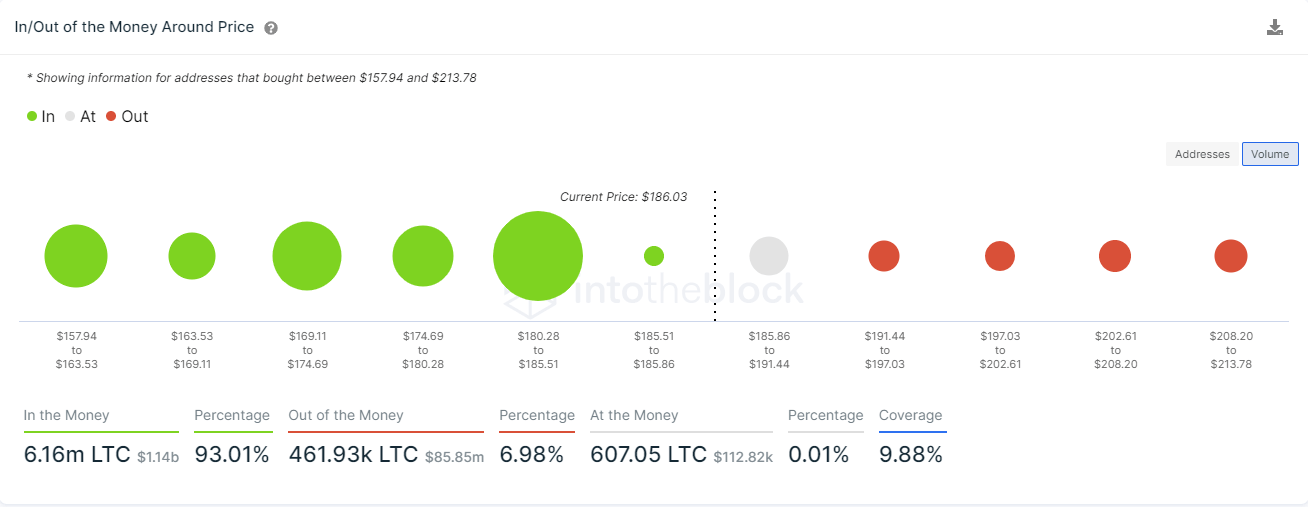
LTC IOMAP chart
Additionally, the number of whales holding between 100,000 and 1,000,000 LTC coins ($18,500,000 and $185,000,000) has increased by three which is significant.
%20[20.03.25,%2011%20Feb,%202021]-637486678858384997.png)
LTC Holders Distribution
However, on the other hand, the symmetrical triangle pattern can also break bearishly if the support level at $182 cracks. This breakdown would push Litecoin price down to $155, a 15% move.