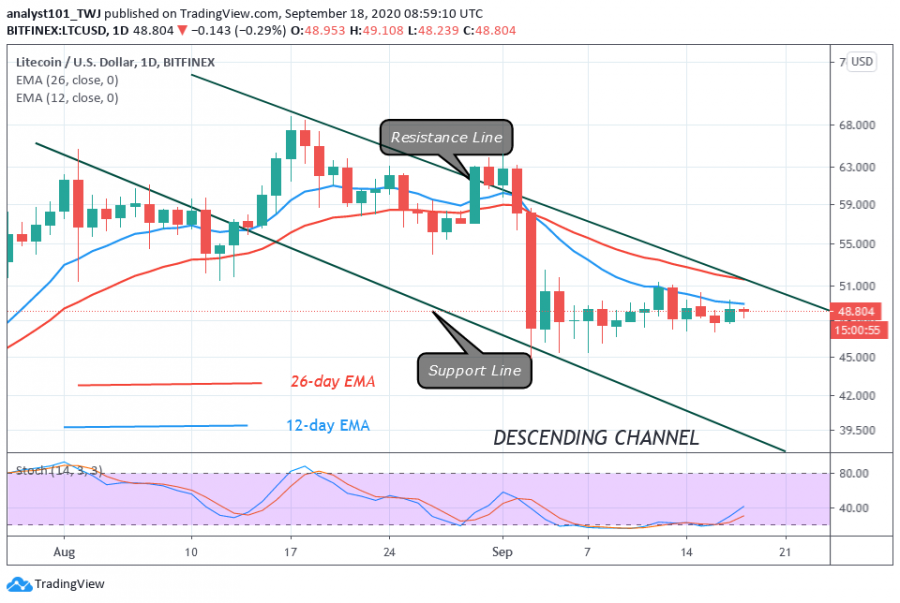
Buyers have failed to scale above the $51 resistance in the last two weeks. This is given the overwhelming selling pressure above the $51 high.
The market failure to trend higher resulted in LTC’s range bound movement between $45 and $51. From the price action, the price is facing rejection at the 12-day EMA. The LTC will fall each time the price tests the exponential moving average. Sellers seem to have the upper hand as LTC falls to $48 at the time of writing.
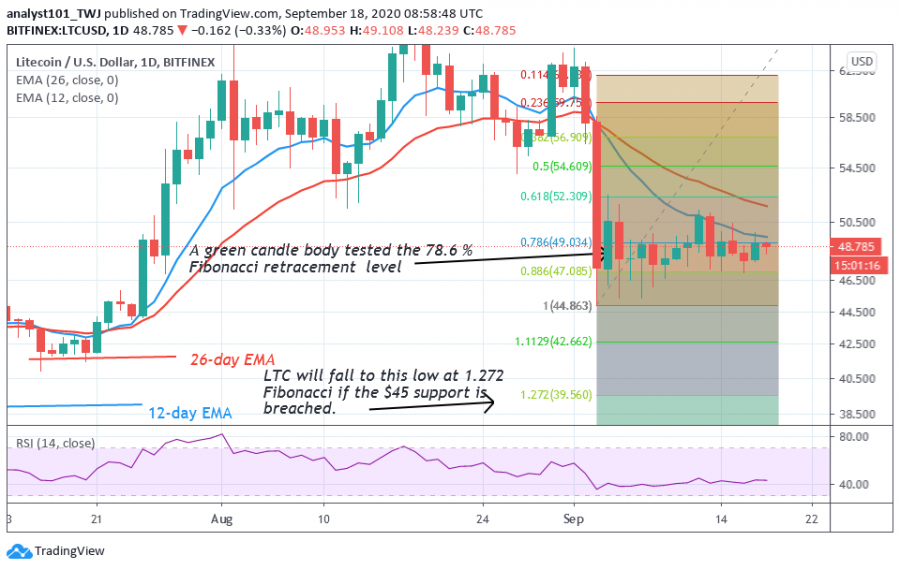
Nonetheless, if sellers break below the $45 support, the market will decline and reach the $39 low. Meanwhile, the crypto is range-bound as the price continues its downward move. On the upside, LTC may rebound above $45 support if the support at $45 holds. In July, LTC rebounded above the support at $42 low.
Litecoin indicator analysis
Litecoin is trading in a descending channel as LTC trades in the middle of the channel. The support and resistance lines are very vital to the LTC price movement. As LTC price is below the EMAs, the support line is likely to be tested. A break below the support line will compel LTC to fall.

Key Resistance levels: $80, $100, $120
Key Support levels: $50, $40, $20
What is the next move for Litecoin?
The price action is yet to determine the direction of LTC as buyers and sellers continue to struggle for price possession in the range-bound zone. The Fibonacci tool analysis of $39 low will hold if price breaks below the support at $45. In the meantime, the price is in the oversold region of the market.

Disclaimer. This analysis and forecast are the personal opinions of the author and not a recommendation to buy or sell cryptocurrency and should not be viewed as an endorsement by CoinIdol. Readers should do their own research before investing funds.
