- Litecoin price seems to have hit a strong resistance level.
- The digital asset could be poised for a short-term correction although it has a lot of support below.
Litecoin hit a high of $185 on January 10 and has been consolidating since then. The digital asset hasn’t really benefited from Ethereum’s breakout in the past few days and continues slowly climbing towards the last high.
Litecoin price faces short-term pressure
On the 4-hour chart, the TD Sequential indicator has just presented a sell signal which in the past has been quite reliable. The call has already some bearish continuation and could drop Litecoin price towards the 100-SMA at $154 or the 50-SMA at $144.
LTC/USD 4-hour chart
However, the In/Out of the Money Around Price (IOMAP) chart shows strong support below $158 and two critical support areas between $144 and $149 and another between $139 and $144 which coincide with the bearish price targets mentioned above.
-637466810085659406.png)
LTC IOMAP chart
On the way up, Litecoin price faces practically no resistance when compared to the support below with the most significant range between $172 and $177.
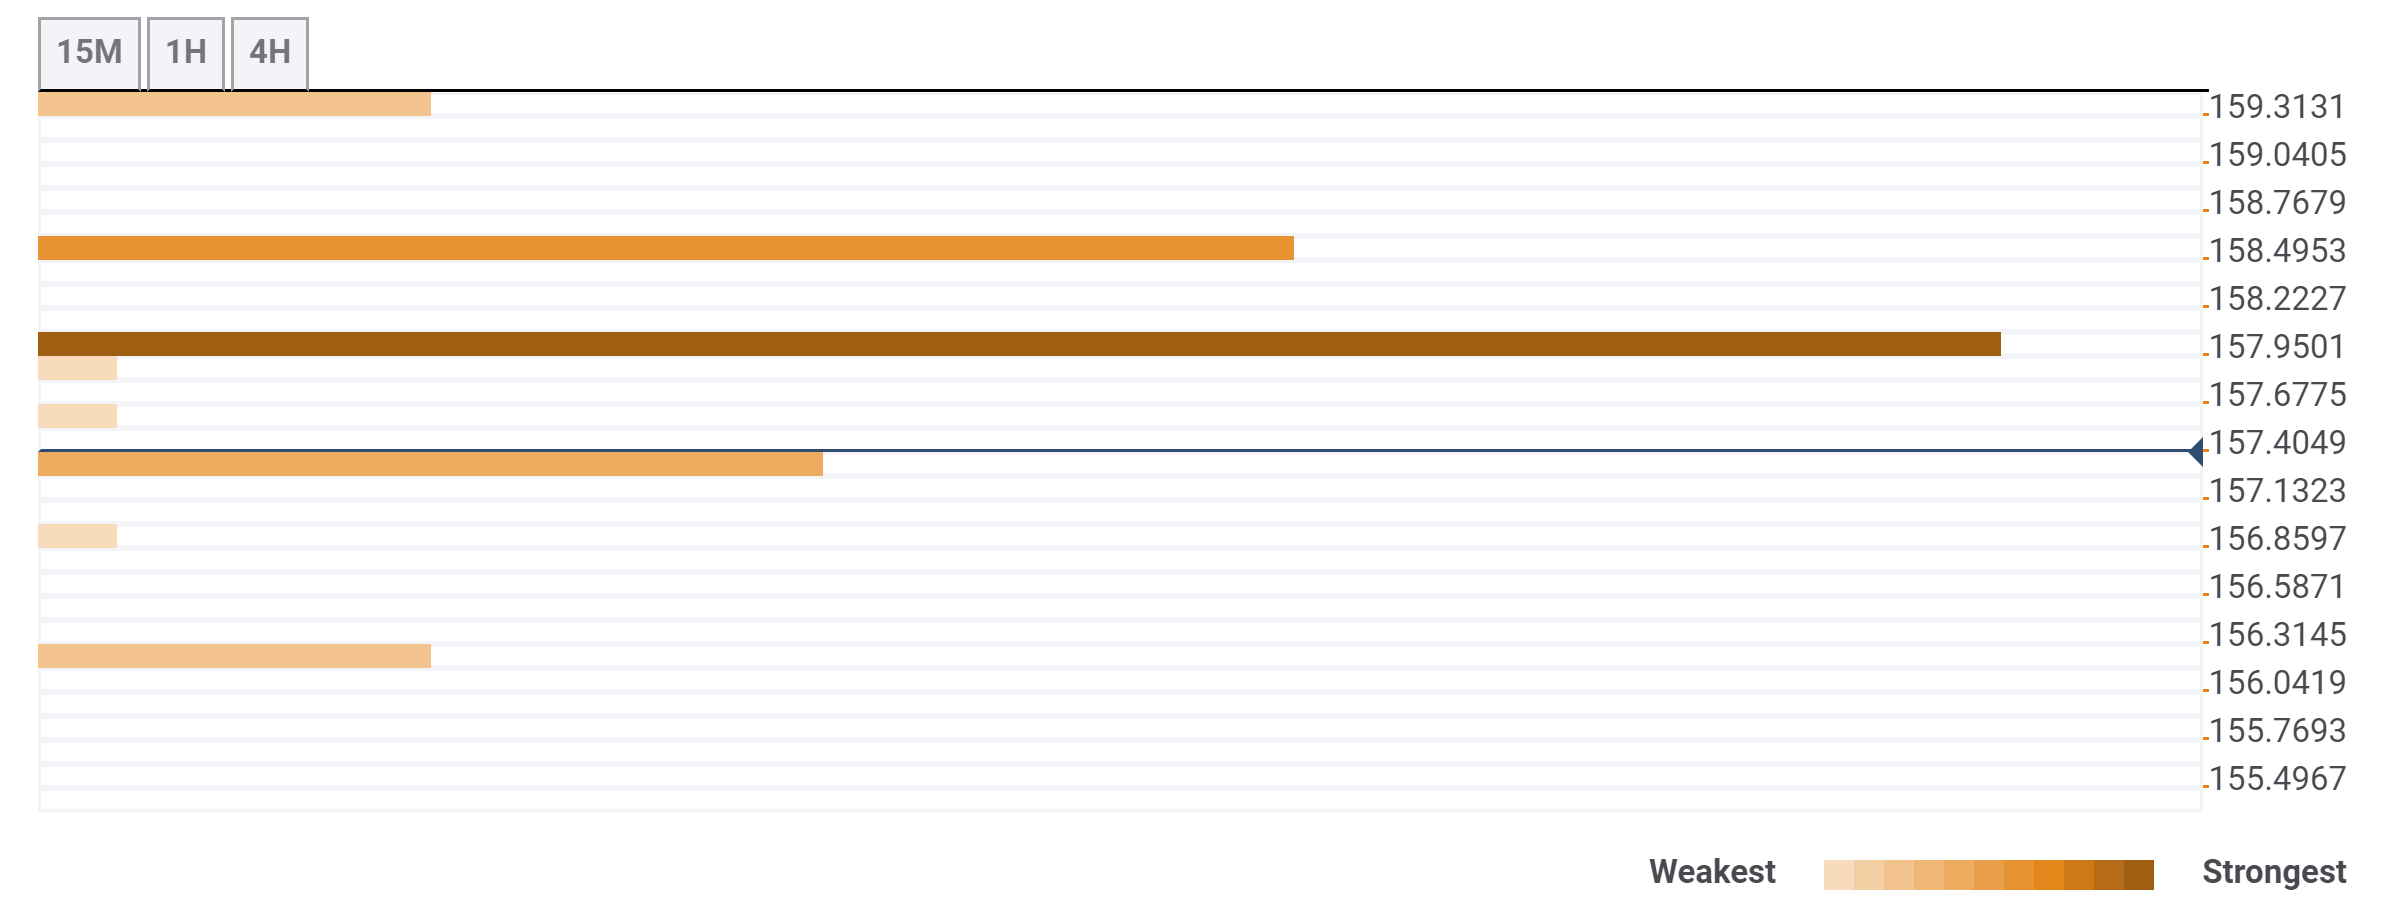
The confluence detector shows a stiff resistance level at $157 which is the 61.8% Fibonacci level on the weekly chart. In addition to this point, the Pivot Point 1 Day R1 at $158 could also pose some trouble for the bulls.

LTC confluences
On the way down we find very little support close to the current price. The $157.1 level where the 100-SMA on the 15-minutes chart and the previous low on the 4-hour chart converge is the most significant support point.
