- Several indicators show Litecoin price might need to pull back further.
- The digital asset remains trading inside a robust uptrend on the daily chart.
Litecoin price is up by almost 60% in the past week hitting a new 2020-high at $124. The digital asset has experienced a healthy correction down to $98 but might need to drop even further as several indicators have turned bearish.
Litecoin price flashes a significant sell signal on various time frames
On the daily chart, the TD Sequential indicator has presented a sell signal on December 21 which seems to be getting a lot of validation. The next significant support level seems to be located at $80, where the 50-SMA currently stands.
LTC/USD daily chart
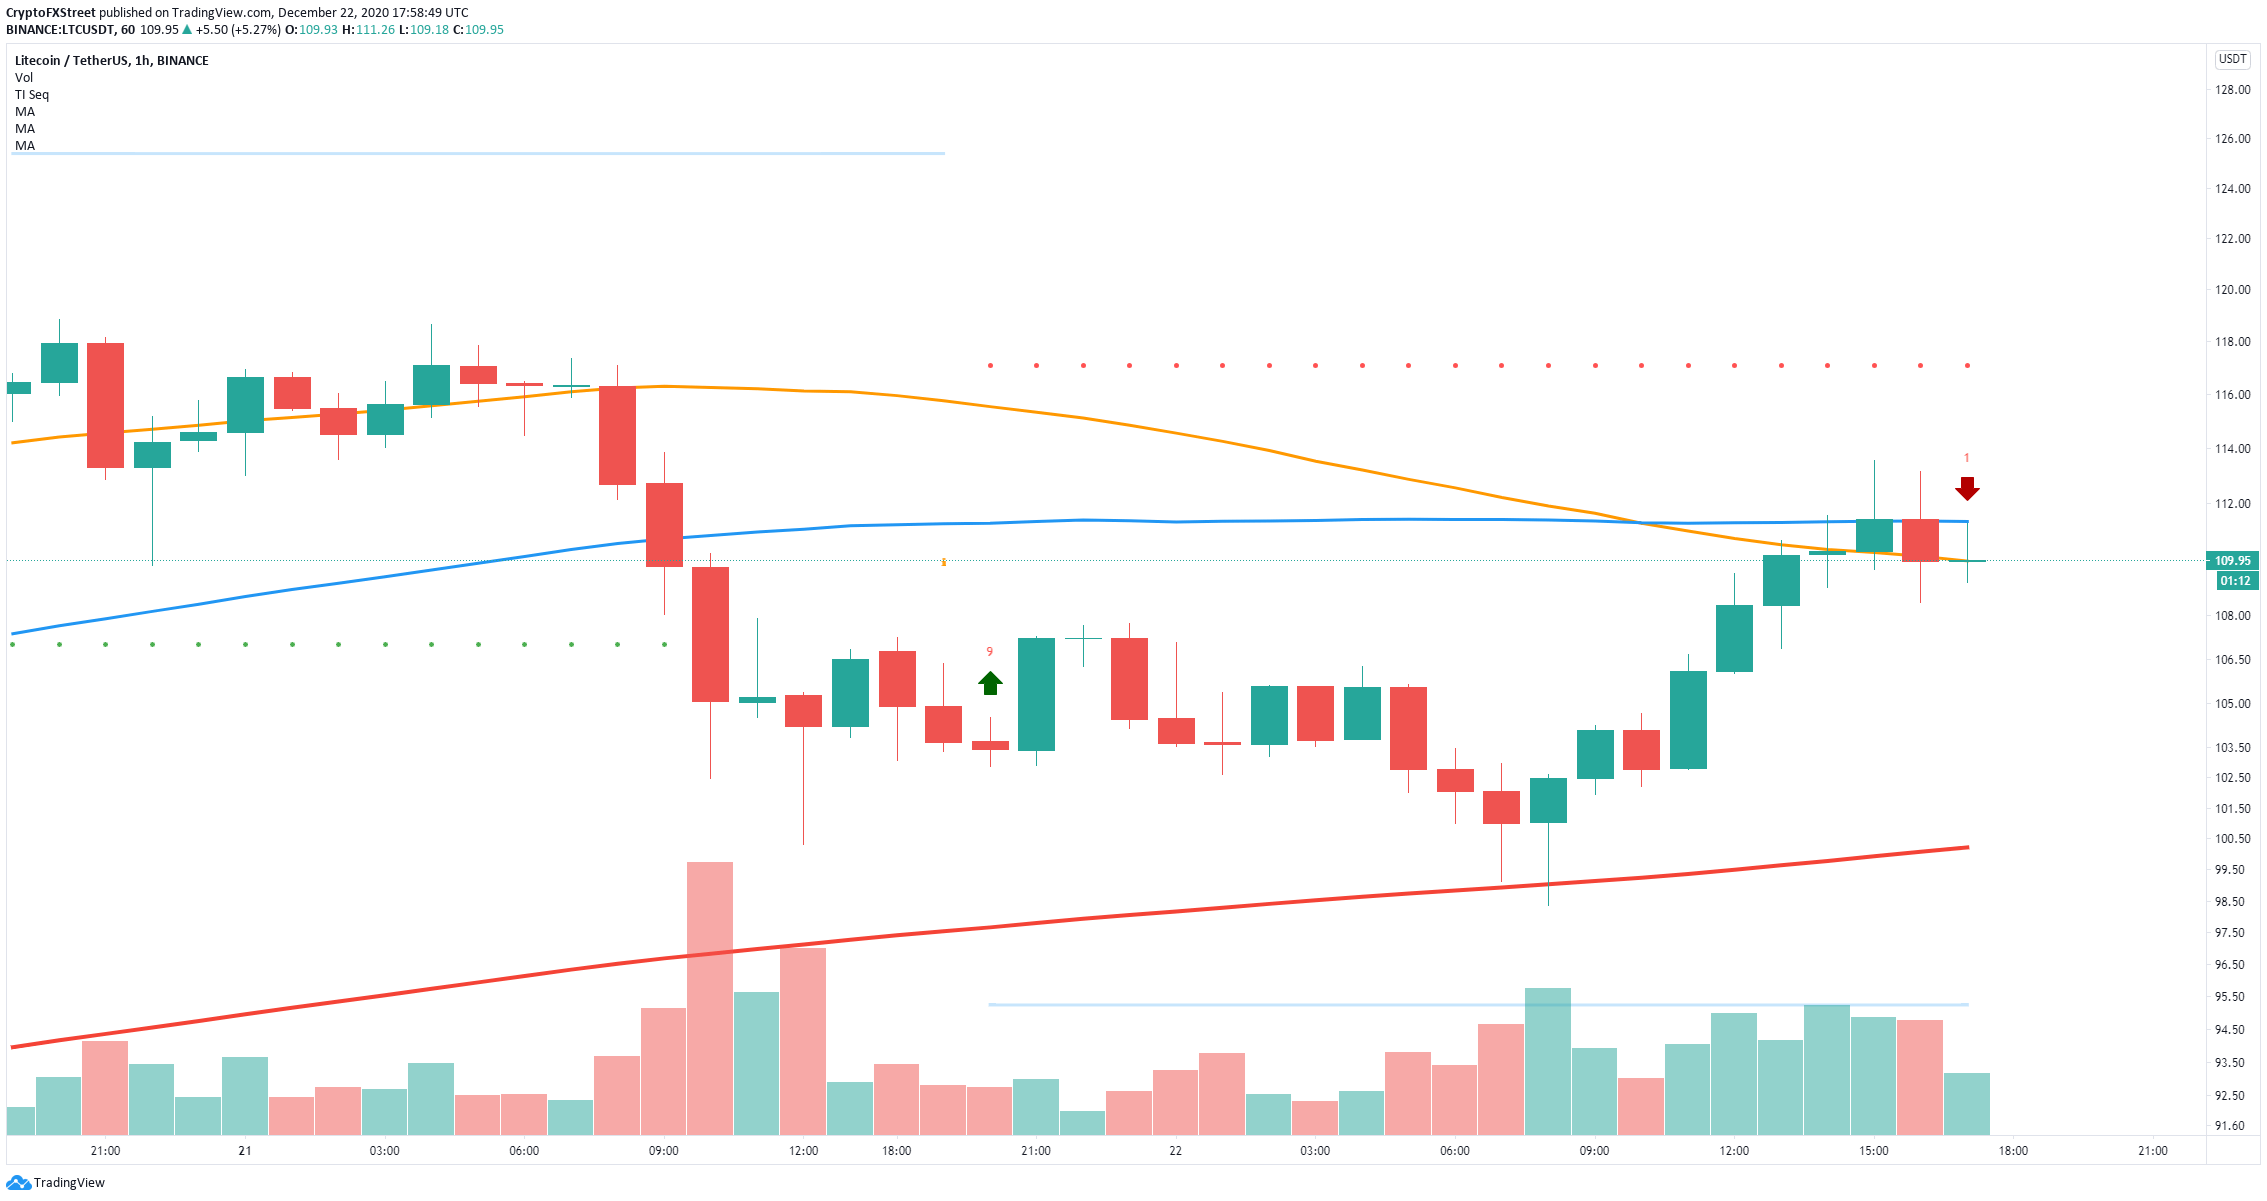
Similarly, on the 1-hour chart, the TD Sequential indicator just presented a sell signal as Litecoin price slipped below the 50-SMA and the 100-SMA. The next potential target would be the 200-SMA at $100.
LTC/USD 1-hour chart
However, if bulls can defend the 50-SMA on the 1-hour chart and eventually push Litecoin above the 100-SMA, Litecoin price can easily target the last high at $118 and potentially the 2020-high at $124.

