- Ethereum price is trading sideways waiting for a clear breakout or breakdown.
- Several indicators suggest that the digital asset could be on the verge of a massive correction.
After its most recent high at $635.7, Ethereum has been under consolidation trading between that level and $560. As the range gets tighter it seems that bears are anticipating a massive sell-off towards $440.
Several key indicators show Ethereum price is poised for a correction
The TD Sequential indicator has presented a sell signal on the weekly and monthly charts simultaneously. In the past, these have been accurate calls on the weekly chart as bears got a lot of continuation from them.
ETH/USD weekly and monthly charts
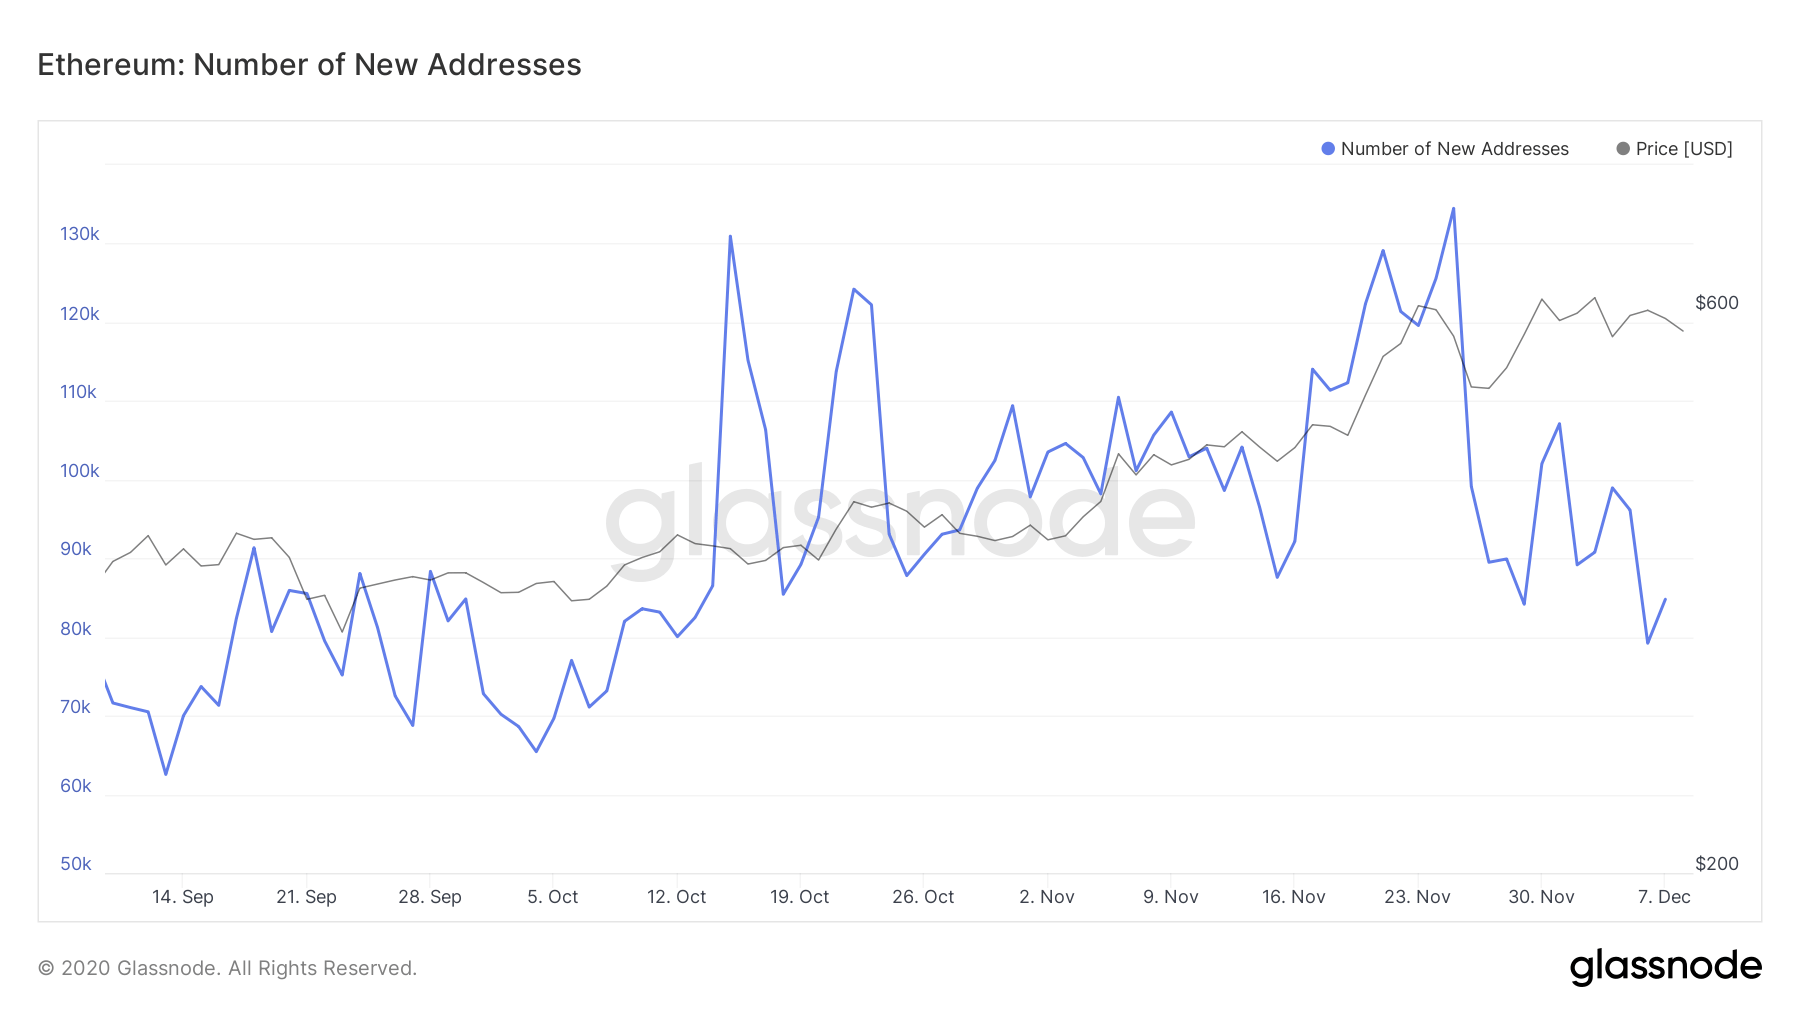
Those sell signals have predicted market tops in the past which means Ethereum price could be on the verge of another one. Additionally, it seems that the number of new addresses joining the Ethereum network is declining.
Ethereum new addresses chart
Since its peak on November 24, less addresses have joined the network and the trend seems to be on the decline now. This shows a lack of interest by new investors in Ethereum despite the price remaining relatively stable.
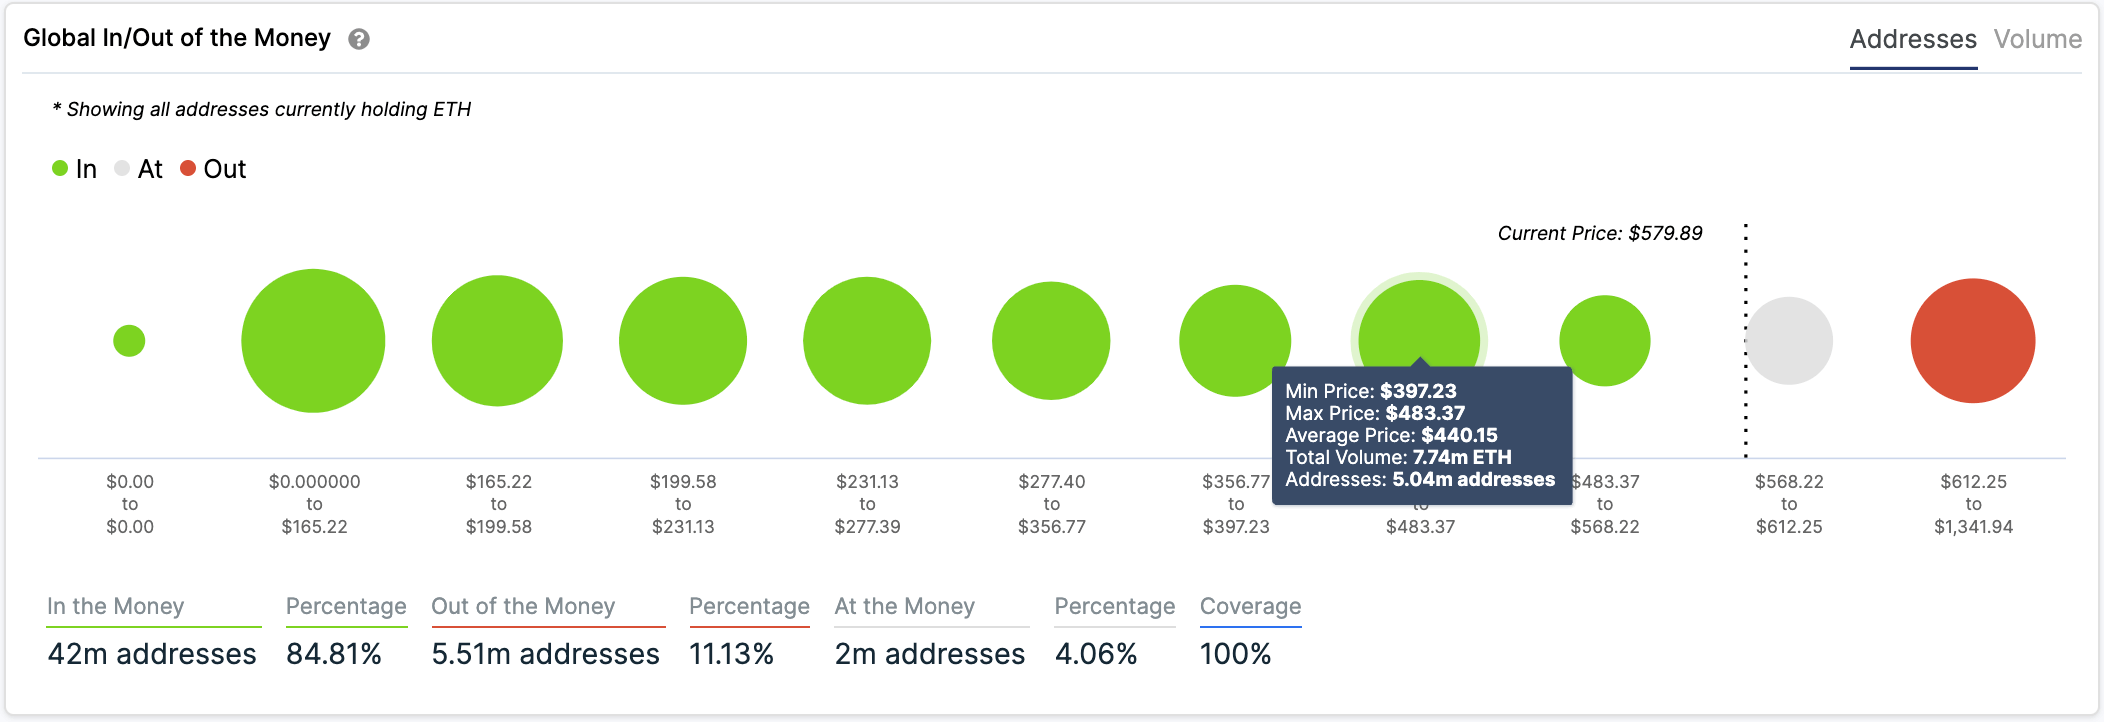
Ethereum GIOM chart
The Global In/Out of the Money (GIOM) chart shows a significant support area around $440, which is the bearish price target. However, the bearish outlook might still get invalidated if the bulls can keep Ethereum above $600 and eventually push it through $630. A weekly close above this level would drive Ethereum price towards the psychological level at $800 or higher.


