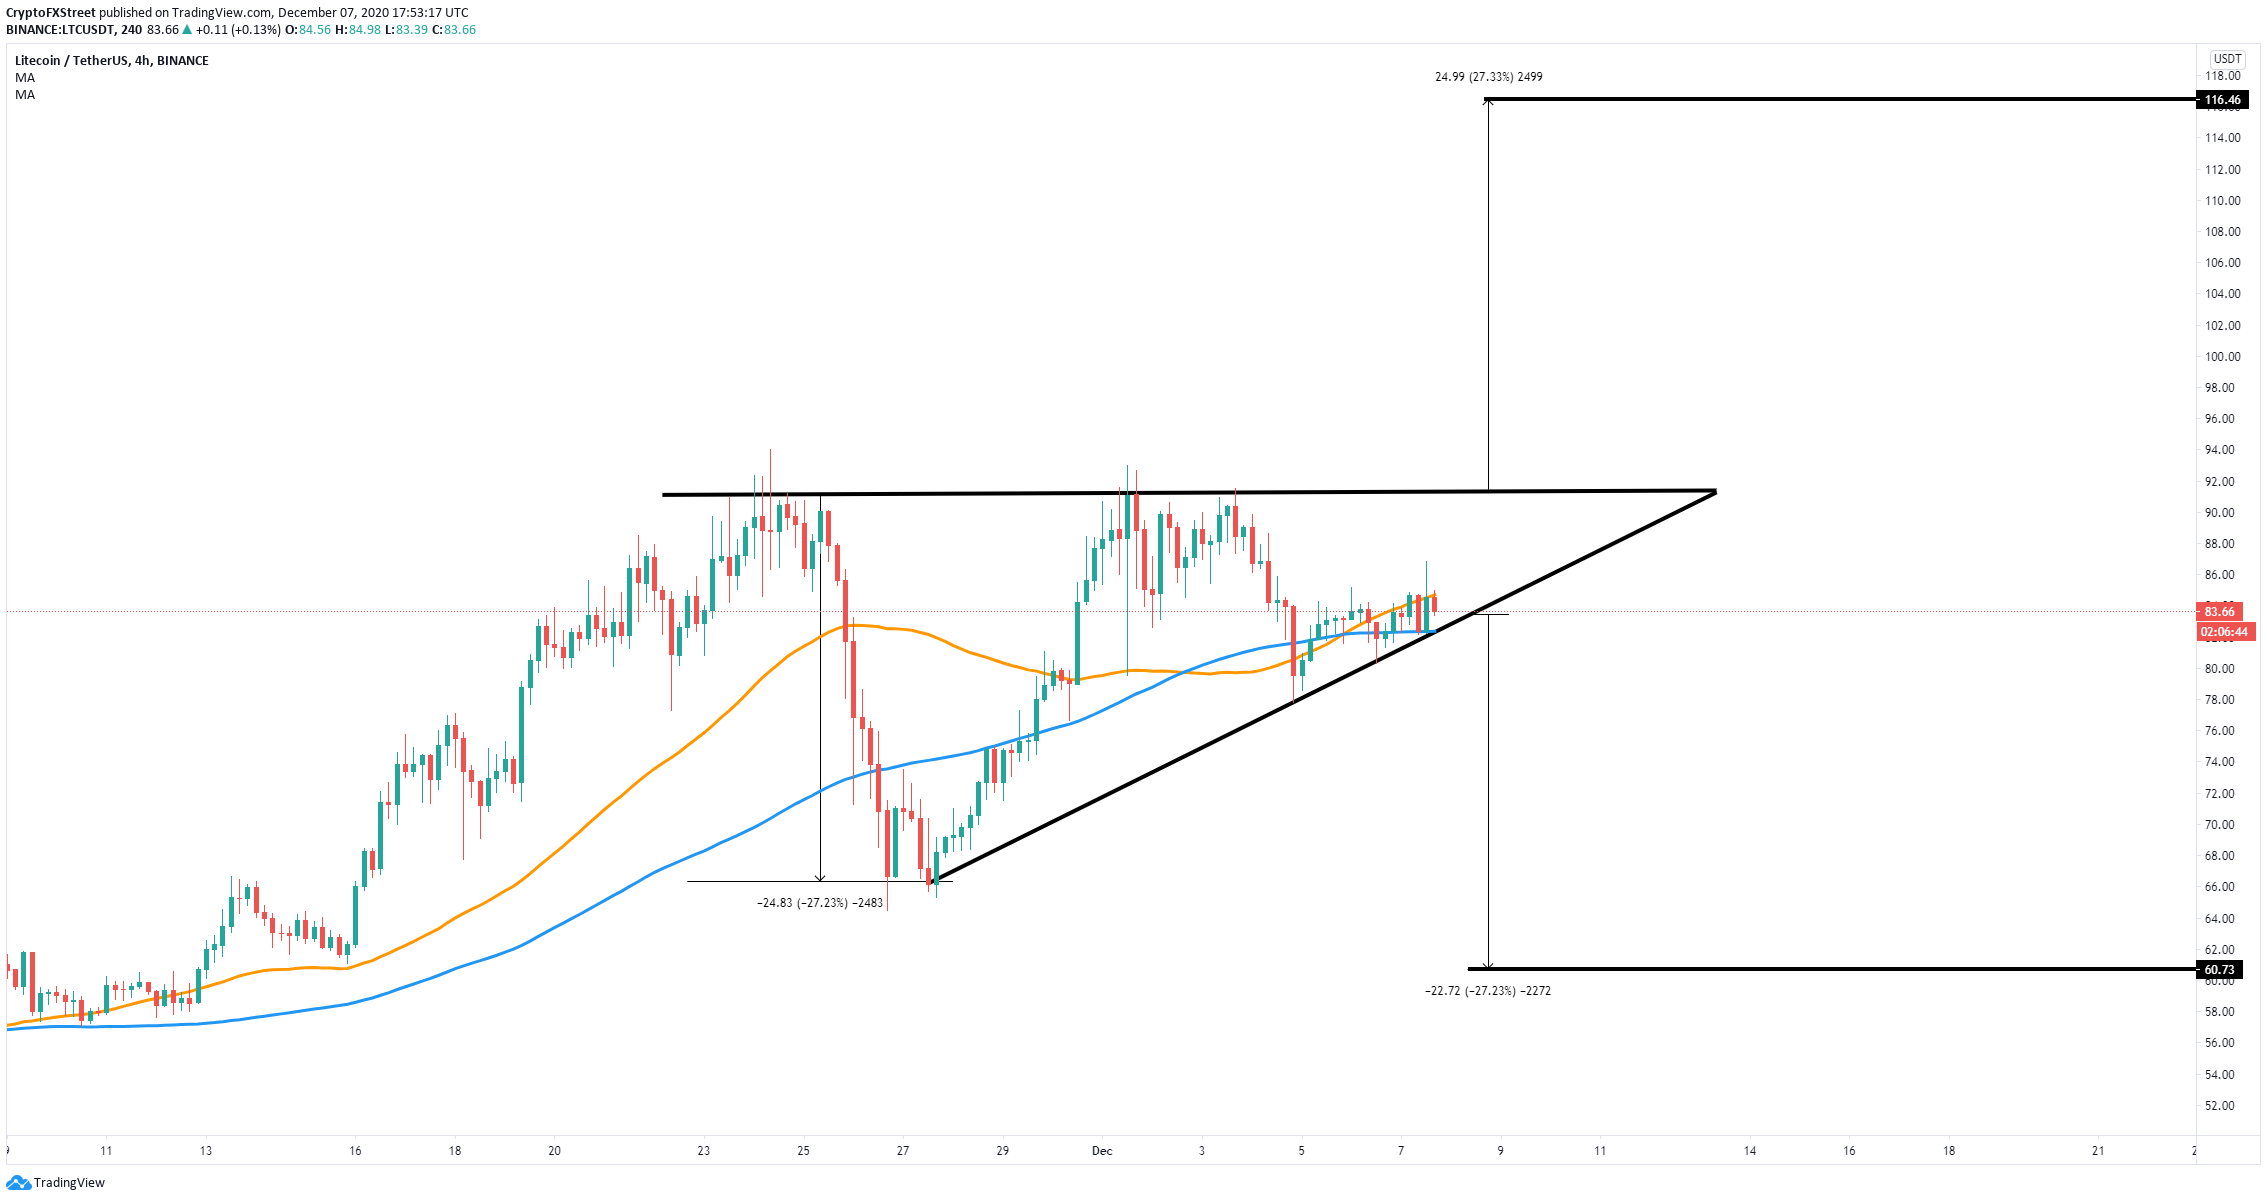
- Litecoin price is currently bounded inside an ascending triangle pattern on the 4-hour chart.
- It seems that LTC whales have been selling significant quantities of the coin, indicating strong selling pressure.
Litecoin is currently trading at $83.71 inside an ascending triangle pattern on the 4-hour chart. Several on-chain metrics show that large LTC investors are selling, which adds selling pressure to the market and shifts the odds in favor of the bears.
Litecoin faces strong selling pressure and a potential dive towards $60
It seems that Litecoin whales have been selling a lot of coins in the past week as the number of holders with 100,000 – 1,000,000 coins has dropped from 121 on November 18 to 114 currently. Furthermore, there are two fewer whales holding between 1,000,000 and 10,000,000 ($83,000,000 and $830,000,000), which is significant.
LTC Holders Distribution chart
On the 4-hour chart, Litecoin price has developed an ascending triangle pattern. A breakdown below the lower boundary of the pattern would drive LTC towards a low of $60.
LTC/USD 4-hour chart
On the other hand, if bulls can recover the 50-SMA support level on the 4-hour chart, Litecoin price could climb towards the upper trendline of the pattern. A breakout above this point would lead the digital asset to a high of $116.
LTC IOMAP chart
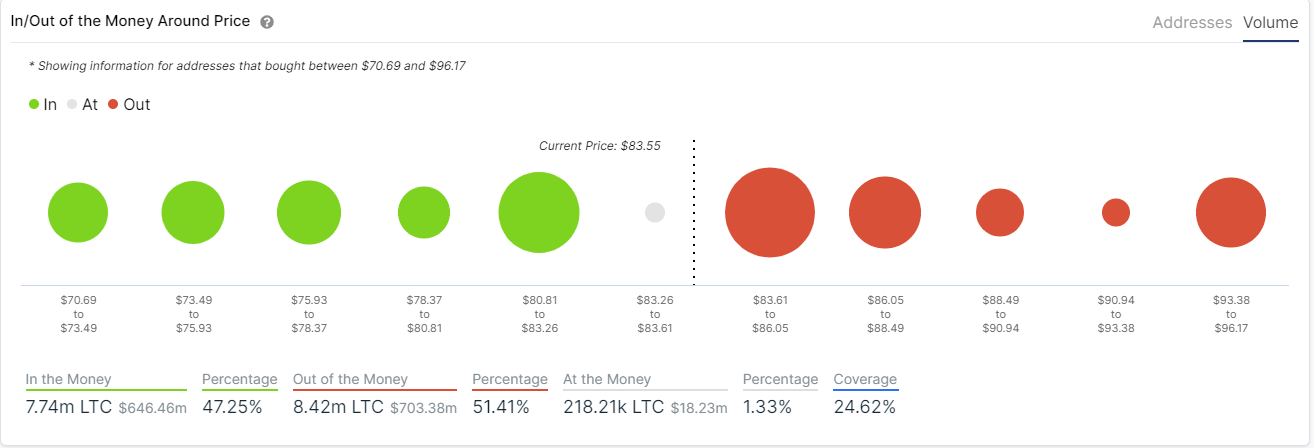
At the same time, the In/Out of the Money Around Price (IOMAP) chart shows a lot of resistance ahead between $83 and $88.5 and one significant support area between $83.26 and $80.81.


