With Bitcoin continuing to hover very close to its $16k-resistance level, many of the market’s altcoins are now having to endure prolonged periods of sideways movement. Such was the case for altcoins such as Binance Coin, Polkadot, and VeChain over the course of the previous week.
Binance Coin [BNB]
Source: BNB/USD, TradingView
Binance Coin’s price has been stuck between its immediate support at $25.7 and its immediate resistance at $31.8. At press time, the token was being traded at $27.9, with BNB having a registered market cap of over $4 billion with a 24-hour trading volume of $276 million. With BNB’s candles turning red one after the other, the cryptocurrency is likely to witness an upcoming short-term bearish spell.
The MACD indicator pictured a bearish crossover, with the Signal line continuing to remain over the MACD line. The RSI echoed a similar sentiment as it was heading into the oversold zone.
Polkadot [DOT]

Source: DOT/USD, TradingView
Currently ranked 9th on CoinMarketCap’s list, Polkadot was being traded at $4.3 with a market cap of $3.8 billion. Over the course of the past 7 days, the cryptocurrency’s price rose by close to 9 percent, however, in the last 24-hours, a minor correction had taken place. Akin to BNB, DOT also found itself stuck between the confines of the $4.2 to $4.4 price range.
The Bollinger Bands continued to contract, signaling low levels of volatility on the charts. This is going to increase the duration of DOT’s sideways movement. Further, the MACD indicator underwent a bearish crossover and pointed to an upcoming dip in price.
In development-related news, Moonbeam, a smart contract chain for Polkadot, was launched recently enabling smart contract developers to run applications on the Polkadot network.
VeChain [VET]

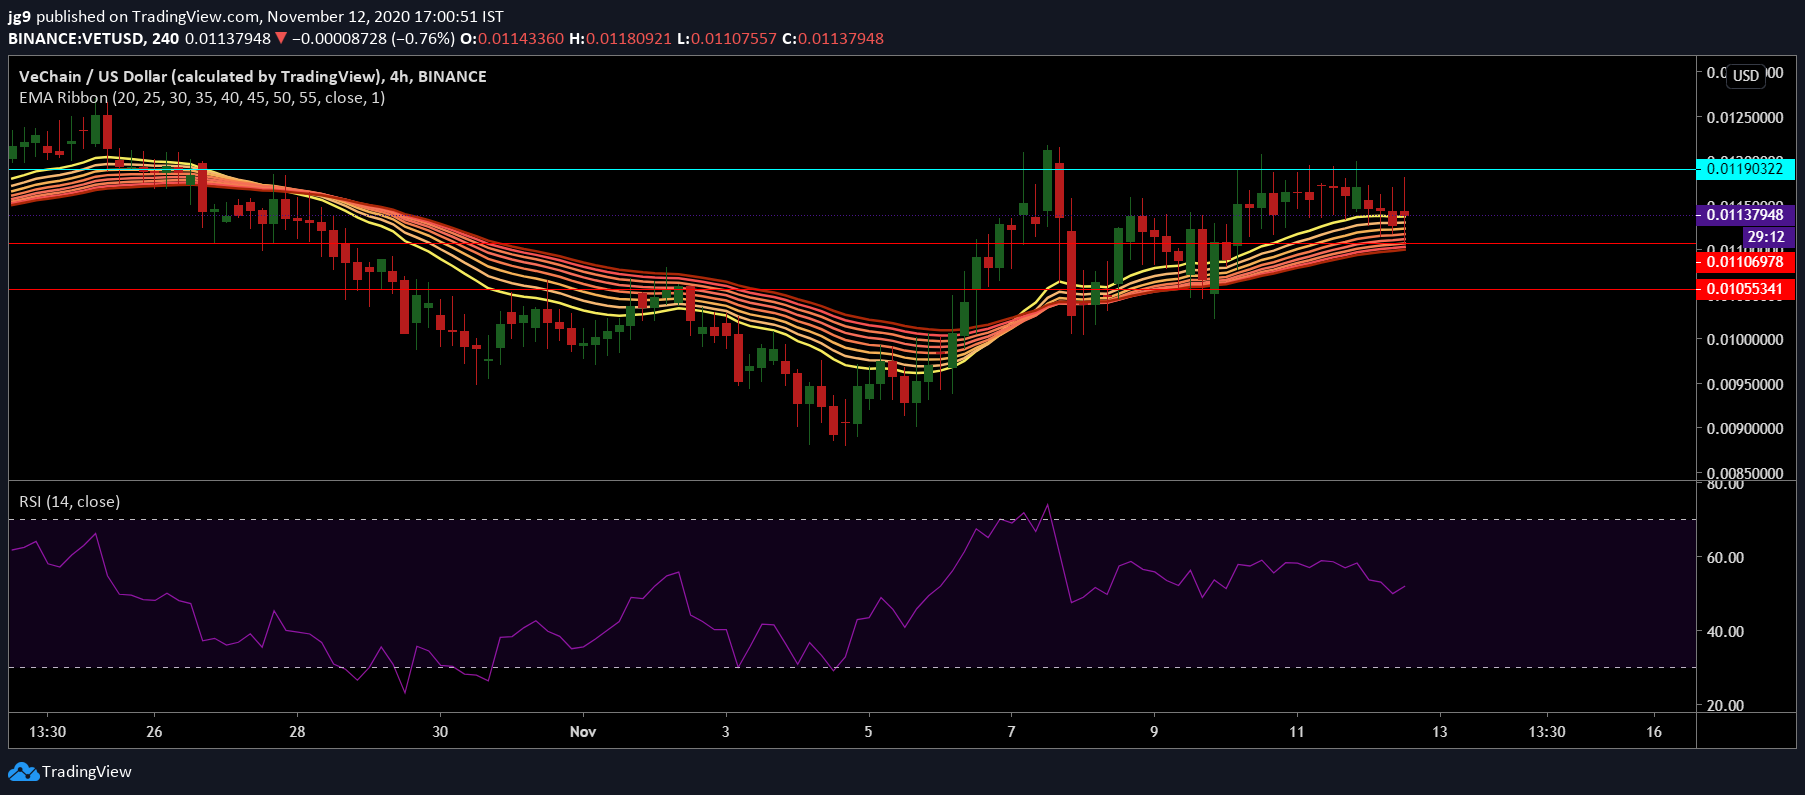
Source: VET/USD, TradingView
Since 8 November, VeChain’s price action has also moved mostly sideways. At press time, the coin was being traded at $0.0113 with a trading volume of $101 million. The cryptocurrency’s trading price was very close to testing the support at $0.0110 and if the price were to see bullish momentum, it may soon be on its way to try and breach the resistance at $0.0119.
According to the coin’s technical indicators, bullish momentum is likely in the short-term. The RSI, at press time, was heading towards the overbought zone and may help the price gain on the charts. The EMA ribbons, having settled below the coin’s trading price, were also likely to offer support by preventing a further dip.
