While the drop-down to $337 was rather unexpected during the start of October, Ethereum’s price started to undergo recovery over the past few days, attaining a position just above $350. With little bullish momentum evident in the charts at the moment, there is a higher chance of another pullback but the price may rally a bit further as well.
Ethereum 1-hour chart
Source: ETH/USD on Trading View
Upon analysis of the 1-hour chart, the price has been observed to mediate within the trend lines of a rising wedge during the last few days of recovery. Right now, the situation going forward may pan out in the following paths listed above.
The green arrow path is a possible flow of continued correction while the red path indicates a possible bearish breakout. With high volatility evident in the trend, and trading volume declining a little bit, a stronger argument can be made for a bearish pullback.
Relative Strength Index or RSI seemed bullish at the moment with buying pressure rising a little, but the trend remains turbulent.
Ethereum 4-hour chart

Source: ETH/USD on Trading View
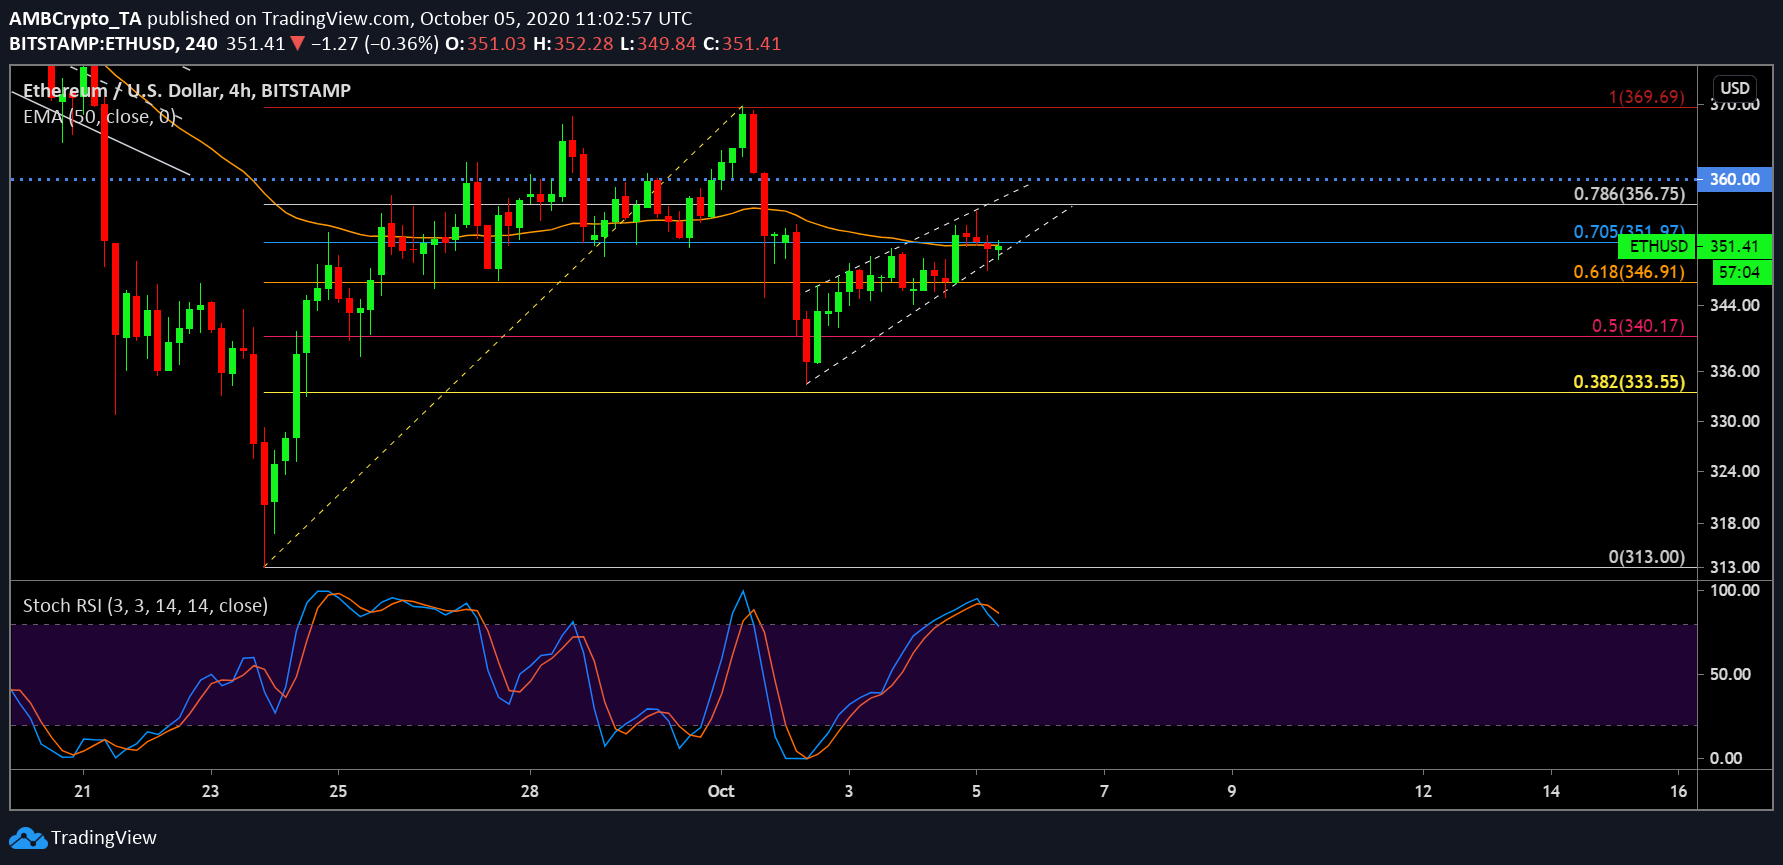
The 4-hour chart clears out a few uncertainties while strengthening the bearish argument. The 4-hour chart suggested that Ethereum is currently trying to break above the 50 Exponential Moving Average but the bullish momentum is unlikely to pull through for a rally. Fibonacci retracement lines suggested that the pullback might occur till $346, upon which the support is at $340.
However, with Stochastic RSI the trend is most likely to move downwards from here on as a bearish cross can be observed at the over-bought position. Considering the trend is occurring on a 4-hour chart, the price might still over fort around the $350 range over the next 24-hours, but eventual collapse will take place for the asset.
Right now, the main concern for Ethereum will be to maintain a position above $340, otherwise a new bottom below $330-$320 might take place.
