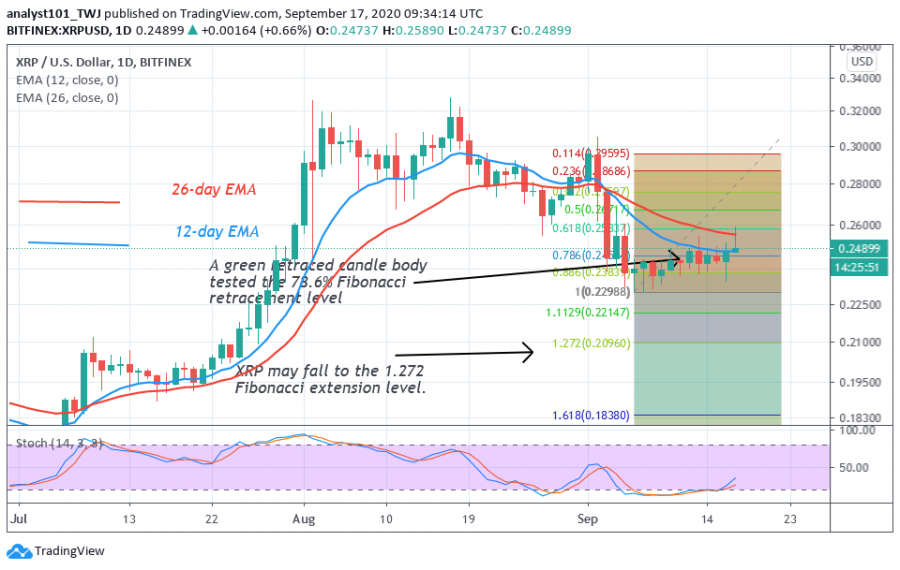
Today, XRP took a giant stride as price almost hit the $0.26 resistance level. This will be the second time, buyers will be making such an attempt at the resistance.
In the first attempt, XRP reached a high of $0.254. A break above $0.26 resistance will enable XRP to resume the upside momentum. Besides, the coin will be trading in the bullish trend zone.
Today, buyers have failed to sustain the price level above $0.26 because of selling pressure. The market has dropped to $0.24 after reaching the $0.26 high. The presence of inadequate buyers at higher price levels has contributed to the recent fall. On the downside, the price has fallen above the $0.24 support level. Since September 10, the market has been stable above $0.24. The crypto is likely to find support above $0.24 and resume a fresh uptrend.
Ripple indicator analysis
The price has broken the 12-day EMA but unable to break the 26-day EMA. A break above the EMAs suggests a further rise of the coin on the upside. The coin will fall if the price is below the EMAs. The crypto is in a bullish momentum above the 30 % range of the daily stochastic. However, the momentum has been weak in recent times.

Key Resistance Zones: $0.35, $0.40, $0.45
Key Support Zones: $0.25, $0.20, $0.15
What is the next move for Ripple?
Ripple is still in the bearish trend zone. Nonetheless, the Fibonacci tool analysis will hold if price breaks below the support at $0.23. The indicator has shown that the retraced candle body tested the 78.6% Fibonacci retracement level. This explains that XRP will drop to 1.272 extension or $0.21 low. At the 1.272 level, the coin will reverse and move up.

Disclaimer. This analysis and forecast are the personal opinions of the author that are not a recommendation to buy or sell cryptocurrency and should not be viewed as an endorsement by CoinIdol. Readers should do their own research before investing funds.
