- Bitcoin price is finding support as price action gets underpinned at $28,695, sparking a turnaround in sentiment.
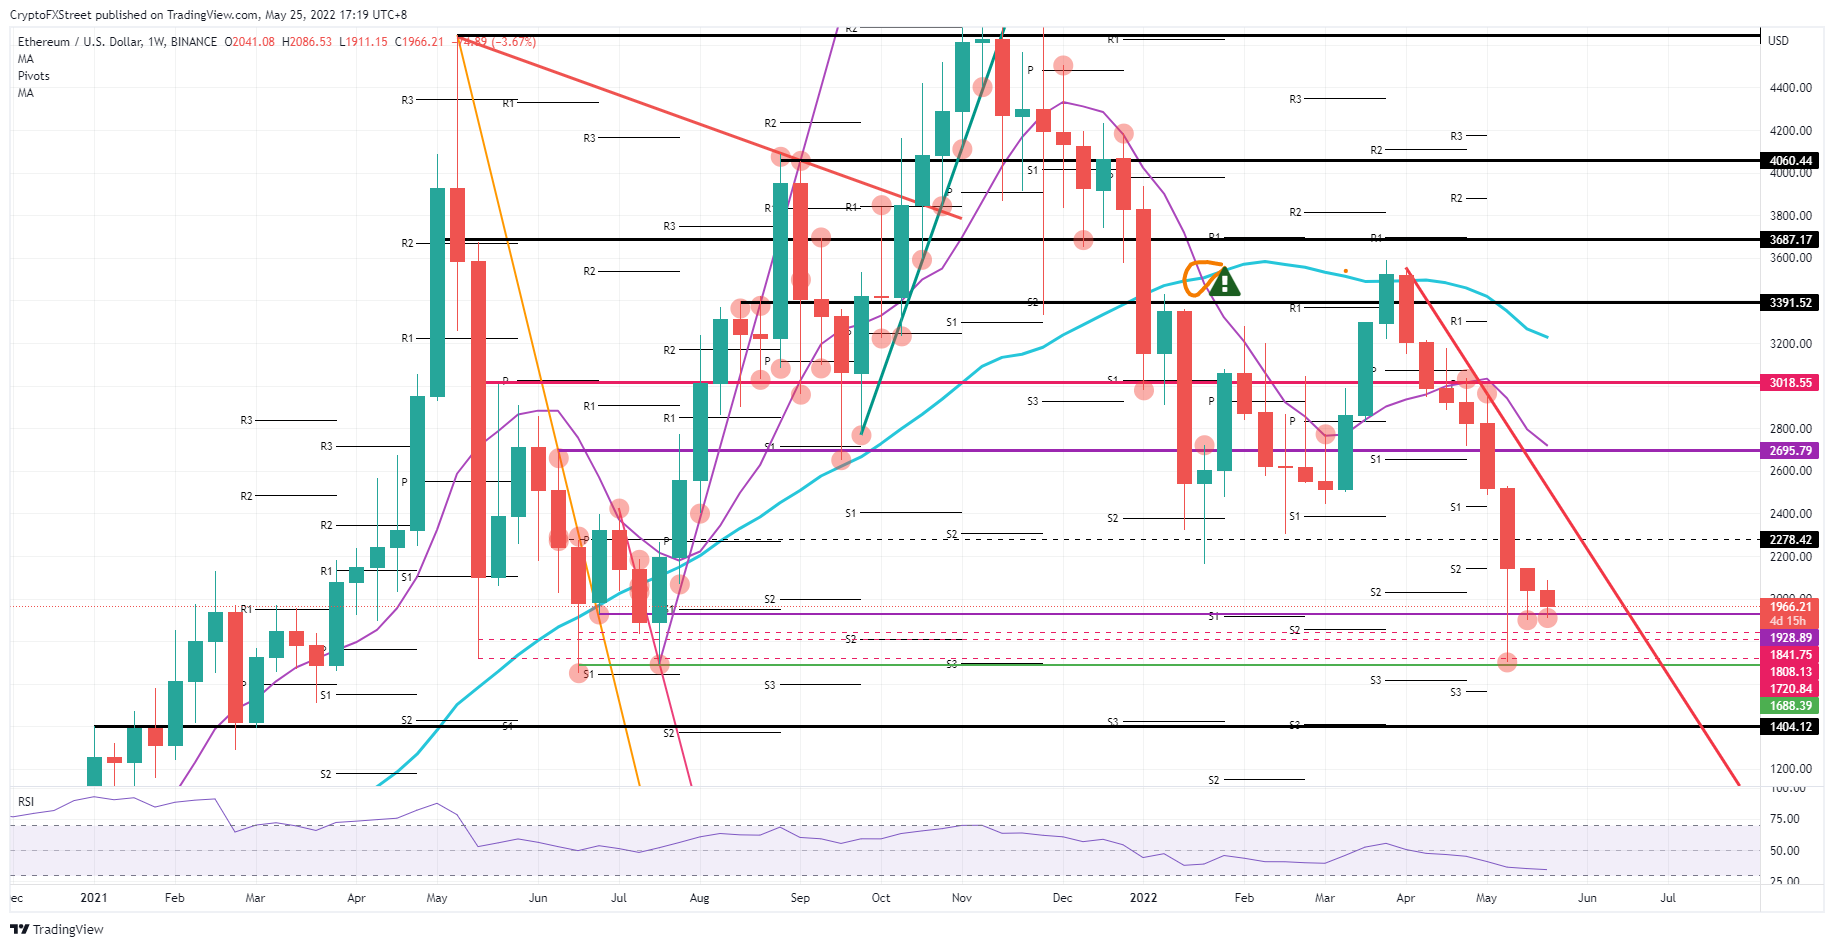
- Ethereum price bounces off $1,928.89 for the second week in a row, showing bulls are adding more weight to the trade action.
- XRP price is set for one more squeeze to the downside as the final bearish sign before a turnaround.
Bitcoin price, Ethereum and other cryptocurrencies are stabilising after the cryptocurrency space got slaughtered last week and two weeks ago. As price action consolidates further across the board, bulls and investors are buying into price action at the lower end as signs price action is underpinned have started manifesting. Expect to see a rally into the end this week and over the weekend as a few tail risks are set to be taken out of the carry.
Bitcoin price set to jump 22%
Bitcoin (BTC) price is set for a turnaround after a very weary downtrend that has been present throughout May. With several tail risks ballooning, the weight was just too much for bulls to defend the key $30,000 handle (and several levels above) and even now the level looks problematic as bears are using the handle to trap bulls and squeeze them out aggressively. But that playbook scenario is set to change in their disfavour as bulls are starting to buy below $30,000 and, by doing so, are underpinning price action, with $28,695.13 emerging as a key support level which has held for a second week in a row.
BTC price is, therefore, seeing some bullish signs, as together with that new supportive level, the Relative Strength Index (RSI) is flatlining and could start to trade up a bit as a sign that bulls are buying into the price action, and outweighing bears. That would translate itself into BTC price action popping above $32,649.28. In case of a daily close above that level this week, the jump would be set for a lift towards $36,709.19, which would start to weaken the downtrend and possibly break it going into next week.
BTC/USD weekly chart
Bears could use the same strategy, however, by massively shorting BTC price at $30,000 and running price action down again in a bull trap. In such a scenario, bulls could get squashed against $28,695.13, creating an open gap with BTC price falling towards $24,000 again, as it did three weeks ago. After that it could possibly take longer for bulls to define a supportive level again, as this would mean further tarnishing Bitcoin price’s already dented image.
Ethereum price sees the hand of bulls in price action
Ethereum (ETH) price is seeing signs of bulls intervening in price action as several external elements for cryptocurrencies start to ease. First and foremost is the dollar’s strength which is starting to fade and is opening up some room to the upside for ETH price, together with tail risks diminishing due to positive signals coming from Moscow on possible talks and the reopening of the ports and trade with Ukraine. Add the mild tailwind from equities which are starting to find a plateau to rally from, and it looks like Ethereum price is finally nearing its turning point.
ETH price is underpinned by bullish action at $1,928.89, as for the second week in a row, the level is holding support and should offer enough demand-side volume for a possible rebound going into the weekend. The fading dollar should open up more room to the upside and see a reduction in bearish volume, with price staging a return to $2,278.42 – an intermediate line in the sand. From there, price action could balloon to 2,695.79 if equities can rally a few consecutive days and the Nasdaq can find some more calm grounds to trade in.
ETH/USD daily chart
However, the crypto winter may not be over yet as ETH price has not yet met its tipping point. As pressure builds to the downside it could translate into price action, with lower highs and a possible break below $1,928.89 towards $1,688.39. Even if ETH price slips through that level, a gap towards $1,404.12 is looming and adding another 30% devaluation to the already haunted price action.
XRP price in steady water, set to unleash the turbo
Ripple (XRP) price is in some calm waters after the vessel took heavy water in rough seas with several risks rolling through financial markets and dollar strength strangling XRP price action. As weeks pass, however, the focus is likely to shift towards the summer, and several tail risks deflating or getting resolved as investors get more and more info and data to fill in the blanks for their future assessment. A turnaround is then expected as the price consolidates and ripens for a bullish breakout.
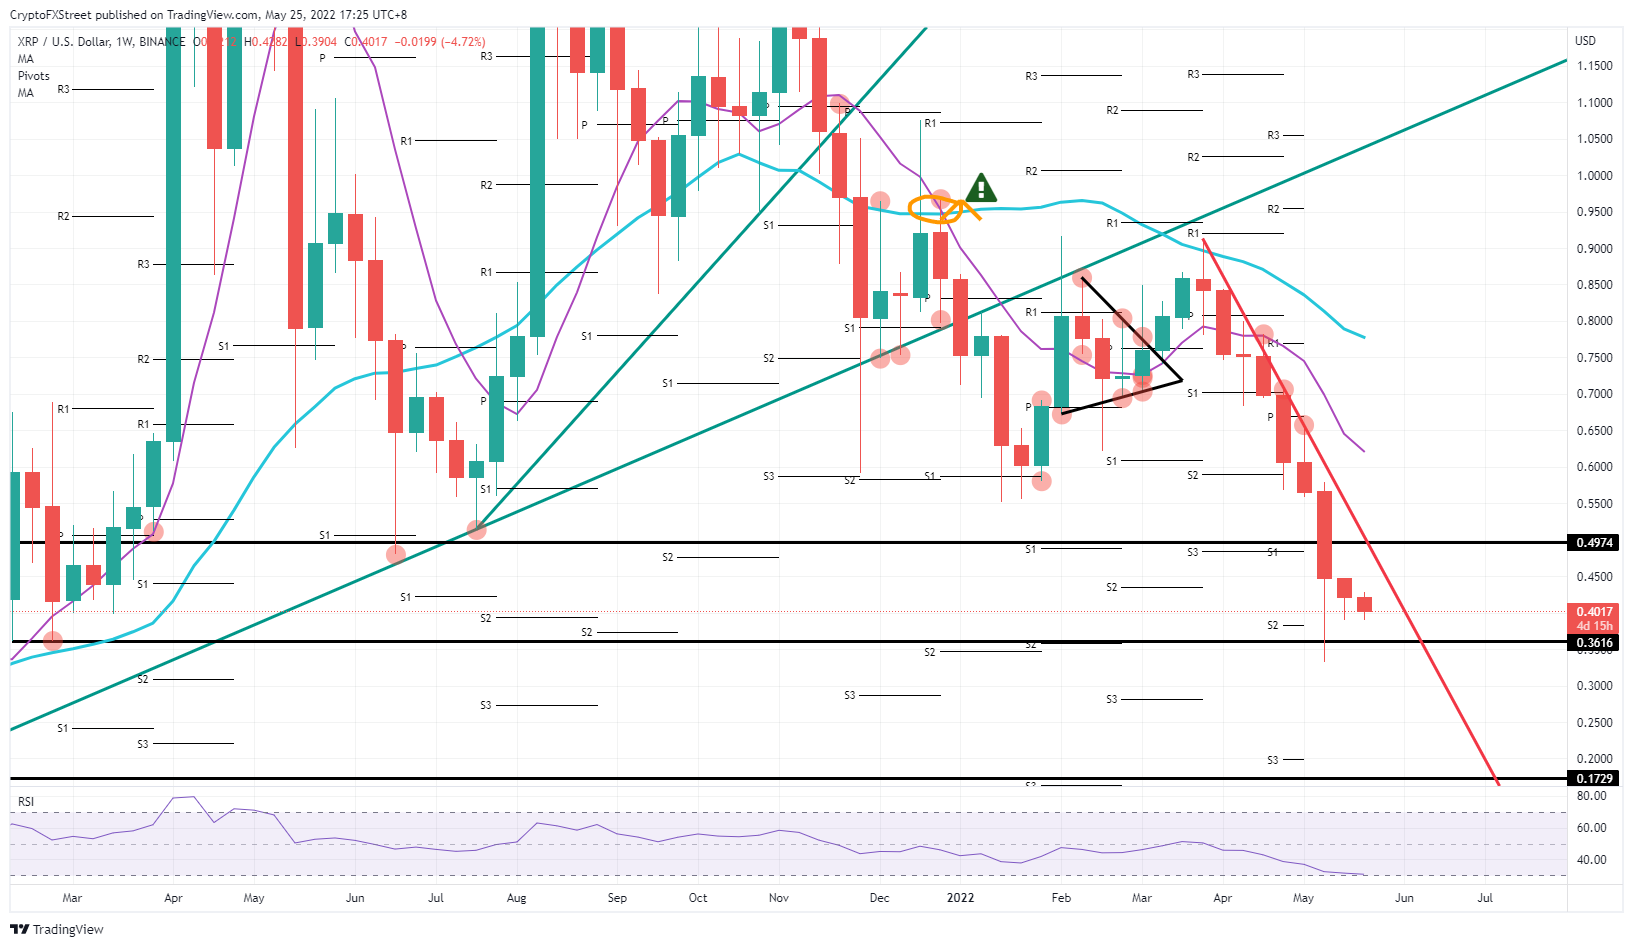
XRP price could then rally back to $0.4974, outpacing ETH and BTC in breaking out of the downtrend by penetrating through the red descending trendline. Indeed, a weekly close above $0.4974 could lead to another leg higher, with price action stretching towards $0.6000. That would mean a 55% price increase for XRP’s performance.
XRP/USD weekly chart
The risk is, of course, that XRP is currently nowhere near any pivotal level that could be used for bulls as an anchor point to jump from. The nearest level at hand is $0.3616, which is another 15% to the downside, but even if bears were able to squeeze bulls out of their positions, a new tin can of losses could get opened up. Once below $0.3600, a massive drop towards $0.1730 could mean an additional 52% of loses on top of the already 15% incurred.


