- Bitcoin price has more room to the upside before encountering the weekly supply zone, extending from $45,550 to $51,860.
- Ethereum price is likely to continue riding the bullish wave to $3,200.
- Ripple price flips a crucial hurdle, signaling a move to $1 is plausible.
Bitcoin price experienced a massive surge in buying pressure that propelled it close to a crucial area of supply. Clearly, there is enough room for upside for BTC, suggesting that Ethereum and Ripple are likely to follow its lead.
Bitcoin price faces decisive moment
Bitcoin price has rallied roughly 14% in the last three days and set up a swing high of $44,998. While this rally is impressive it will approach the weekly supply zone, extending from $45,550 to $51,860.
There is a good chance BTC will pierce this zone and form a local top at $48,464 – to move beyond this level, however, will require a massive surge in buying pressure and is unlikely. At most investors can expect a higher high relative to the 10th February swing high at $45,956.
From a short-term perspective, investors can expect Bitcoin price to retrace to the weekly support level at $42,748. If investors continue to book profits BTC could pull back to the next support level at $39,481.
A long-term bullish outlook is possible if Bitcoin price can produce a daily candlestick close above $52,000. In such a scenario, market participants can expect BTC to set up a higher high and make a run at the $60,000 psychological level.
BTC/USD 1-day chart
On the other hand, if Bitcoin price pierces the daily demand zone, extending from $36,398 to $38,895, It will indicate weakness among buyers. However, a daily candlestick close below $36,398 would invalidate the bullish thesis.
Ethereum price position for further upside
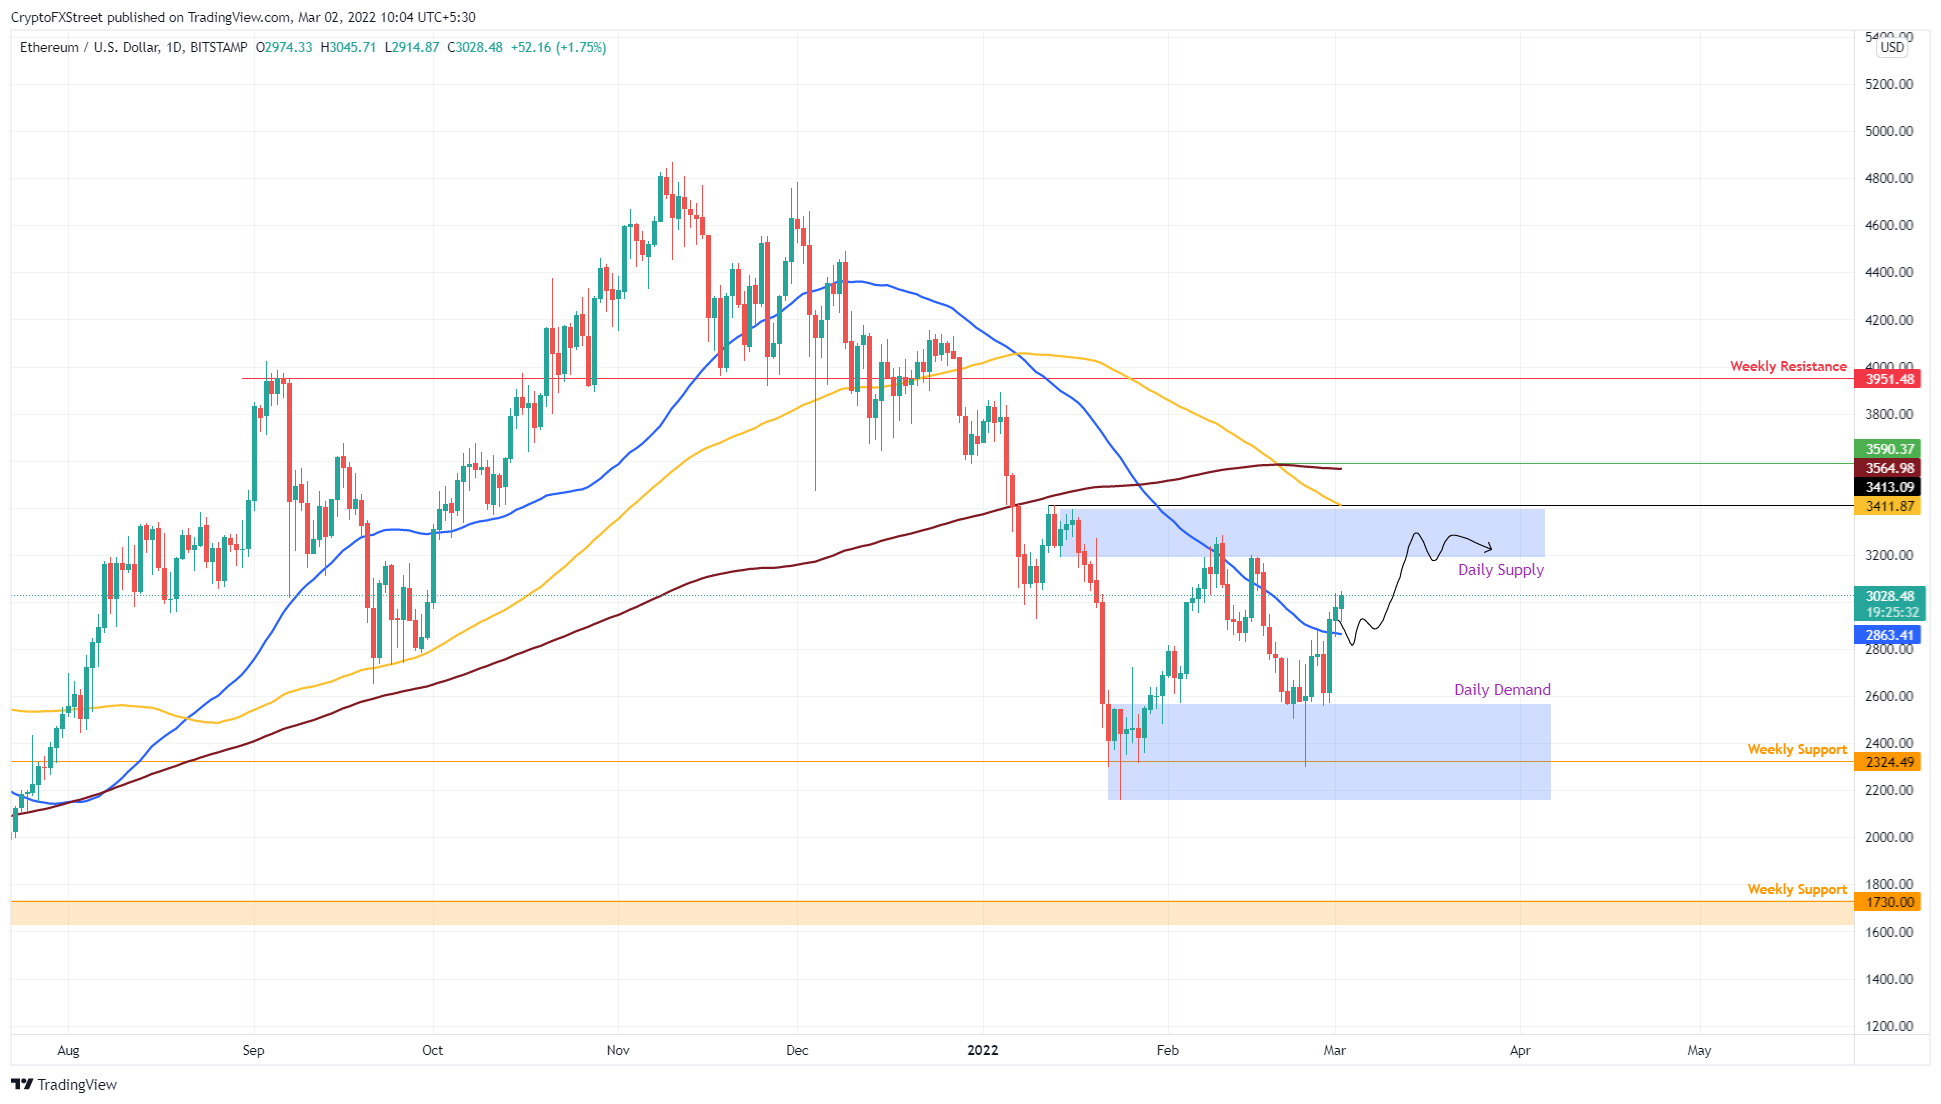
Ethereum price has bounced off the top of a demand zone at $2,567 and rallied roughly 12%, to set up a swing high at $3,045. This move has also pierced the 50-day Simple Moving Average (SMA), establishing a bullish outlook.
Going forward, investors can expect price to retest the 50-day SMA and make a run at the daily supply zone, extending from $3,188 to $3,393. Any move beyond the supply zone is unlikely and will require a massive spike in buying pressure.
In a highly bullish case, the upside for ETH could be capped at $3,600 which is the crossover point between the 100-day SMA and 200-day SMA.
ETH/USD 1-day chart
While things are looking up for Ethereum price, a breakdown of the 50-day SMA will reveal weakness among buyers. In this situation, ETH could retrace to the daily demand zone, extending from $2,160 to $2,567.
A breakdown of this support area will invalidate the bullish thesis for ETH and open the door for bears.
Ripple price looks ready for gains
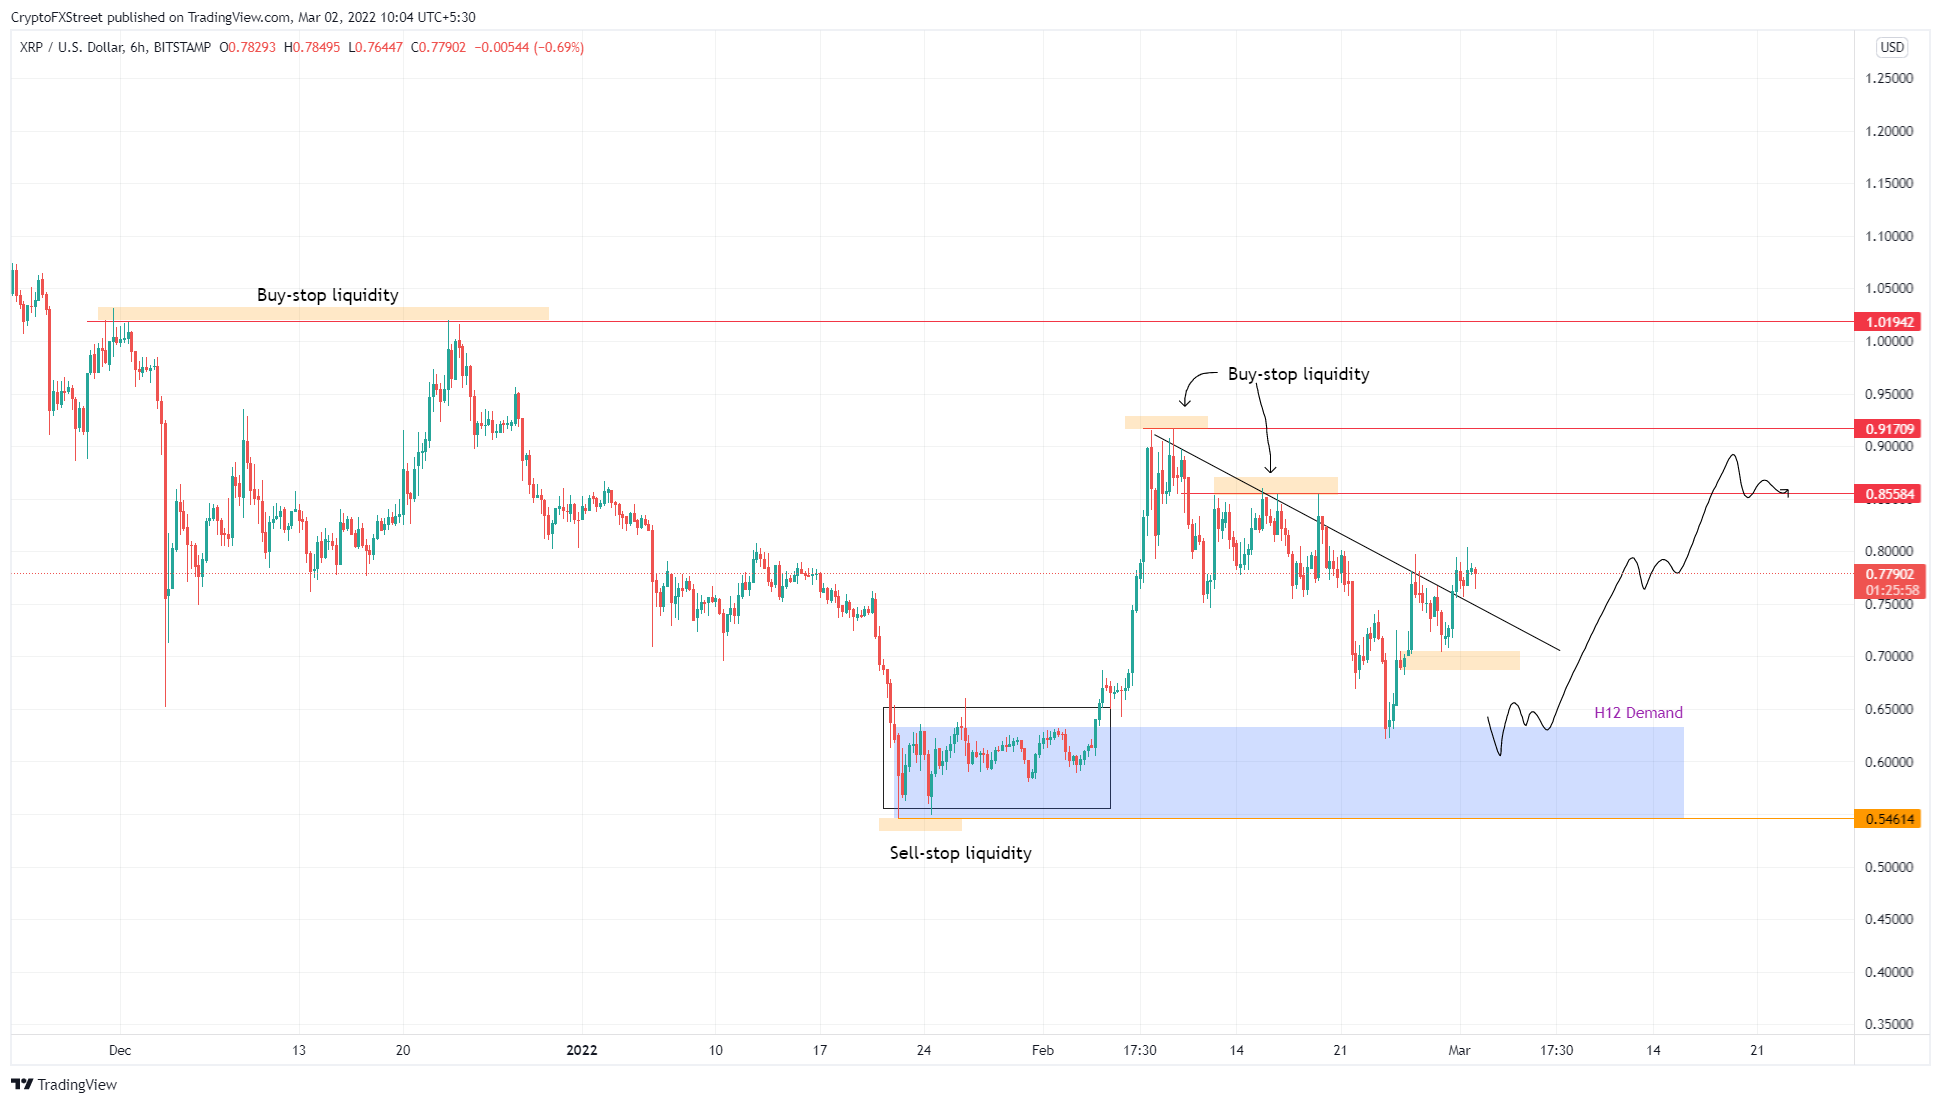
Ripple price has sliced through a declining resistance level indicating a breakout. A consolidation here could be the key to triggering a quick run-up to $0.85. This move will represent a 10% upswing and is a temporary top.
Due to the presence of buy-stop liquidity above $0.85 and $0.91, there is a good chance market makers will push XRP price higher. In a highly bullish case, the XRP price could climb higher and retest the one dollar psychological level and collect the liquidity resting above it.
XRP/USD 6-hour chart
Regardless of the bullish outlook in the crypto markets – if the Bitcoin price crashes, XRP price will follow suit. If that were to be the case, the demand zone, extending from $0.68 to $0.71 will play a crucial role in absorbing the selling pressure and ending the bear rally.
A decisive close below $0.68, however, will invalidate the short-term bullish outlook by creating a lower low. This development could open up the path for a further downswing to $0.63.


