ATOM/USD Looking for Suitable Support
Cosmos (ATOM/USD) breached the uptrend at around $37, in a bearish momentum that saw it find minor support at $30 on October 7. At the time of writing, ATOM/USD was trading at $33.8. The crypto token has dipped 2.09% in the past 24 hours, to bring its total losses to 10.22% in a week.
Can ATOM/USD correct to the upside and continue with the bullish trend?
ATOM/USD– 4-Hour Technical Outlook
Looking at the 4-hour chart above, ATOM/USD found support at $34 on October 7, before dipping lower to $32 on October 10. This means that ATOM/USD could be on its way to lower levels, in a continuation of the short-term bearish momentum.
The appropriate question now is what level the prices will reverse at, to enable the opening of potential buy trades?
ATOM/USD Trade Idea
ATOM/USD is on a short-term downtrend. However, it has been on a clear uptrend since the second week of September, which means a bullish reversal could occur, in continuation with the long-term uptrend.
The level $30 is a potential short-term support, where lower prices could be rejected. The second important level is at $26. As a trader, I would be patient, and wait for bullish price reversal signals at either of these two points before entering a buy trade.
XRP/USD on a Retrace. Consider a Buy at These Points
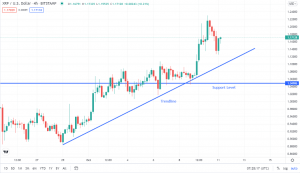
Ripple (XRP/USD) moved from $1.05 on October 8 in a bullish momentum, before facing resistance at $1.23 on October 10. The bullish move is connected to positive developments in the legal tussle with the Securities and Exchange Commission. According to BeinCrypto, a letter to the US Judge in the matter seems to be giving Ripple some edge at last.
At the time of writing, XRP/USD was trading at $1.16, and it appeared to be on its way down. However, although XRP/USD is down by 2.34% in the last 24 hours, it is far from wiping out the 12.61% gains of the last week.
XRP/USD– A 4-Hour Technical Outlook

Looking at the 4-hour chart above, XRP/USD has been bullish since finding support at $0.8 towards the end of last month. $1.1 to 1.04 is now acting as potential support, with the short-term bearish move potentially going lower.
XRP/USD Trade Idea
I maintain a bullish view of XRP/USD in the near term, in line with the developing bullish momentum.
I would consider a buy trade if prices retrace to the $1.1 to 1.04 support area. Alternatively, prices could find support at a 50% retracement, towards or at the ascending trendline, before continuing with the bullish momentum.
Currently, I am keen on the formation of bullish reversal signals at the current retrace towards the areas mentioned. If I went long, I would target the previous high of $1.23 as my first profit target. The other targets would be at $1.28 and $1.31. Happy Trading!
