- Litecoin price formed a ‘W’ pattern, also known as a double bottom on the 12-hour chart.
- Several on-chain metrics give LTC the upper hand as there is weak resistance on the way up.
- LTC must conquer a key resistance level for a potential breakout towards $300.
Litecoin (LTC) has been trading in a 12-hour uptrend since March 25 but suffered a 12% correction in the past 24 hours as the entire crypto market plummeted. The digital asset is poised for yet another leg up according to several indicators and on-chain metrics.
Litecoin price is one barrier away from $300
On the 12-hour chart, Litecoin forms a double bottom pattern and displays the uptrend beginning on April 5 where price nearly reaches the previous high at the beginning of the pattern. The most significant resistance barrier is formed at $246.75.
LTC/USD 12-hour chart
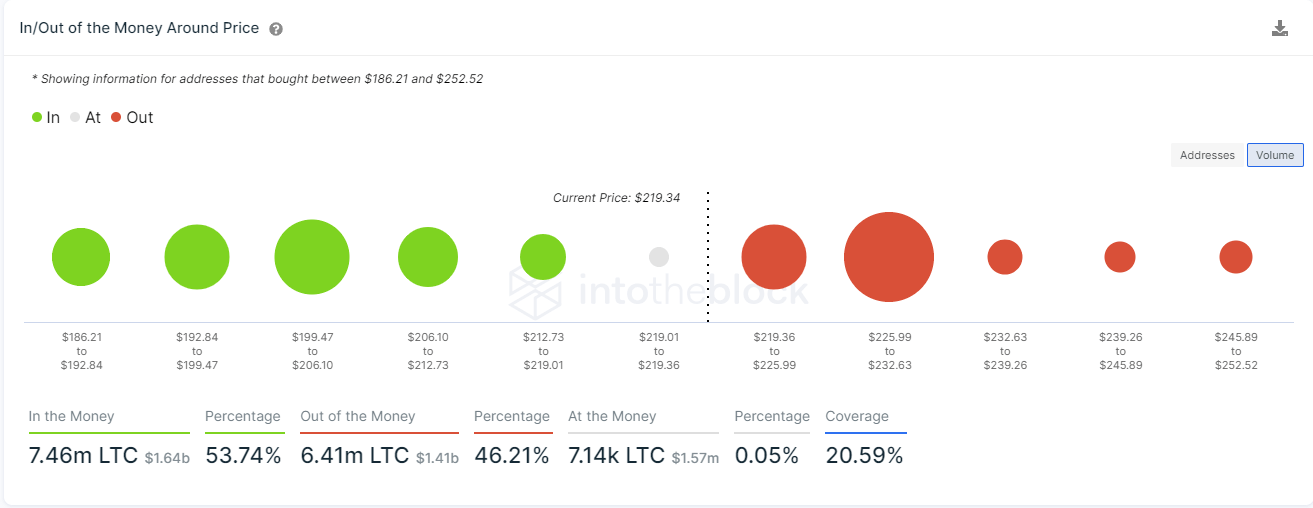
The In/Out of the Money Around Price (IOMAP) chart indicates that the range between $226 and $232 is the strongest resistance area where 84,100 addresses purchased over 4.2 million LTC coins.

LTC IOMAP chart
Passing through this level should quickly drive Litecoin price towards $246.75. A breakout above this point gives us a target of over $300 calculated using the height from the double bottom to the upper trendline resistance.
%20%5B18.44.43,%2007%20Apr,%202021%5D-637534139669464441.png)
LTC Holders Distribution
Additionally, the number of whales holding between 100,000 and 1,000,000 LTC has been increasing by six for the past two months which shows that large holders continue to accumulate the digital asset.
To invalidate the bullish outlook, bears must push Litecoin below $200 which is a psychological level and coincides with the 100-SMA and the 50-SMA support points. This breakdown can drive Litecoin price towards the low end of $170.
