The last day of March has begun with no vivid bullish or bearish signals as some coins are in the red zone while others remain in the green.
Top 10 coins by CoinMarketCap
BTC/USD
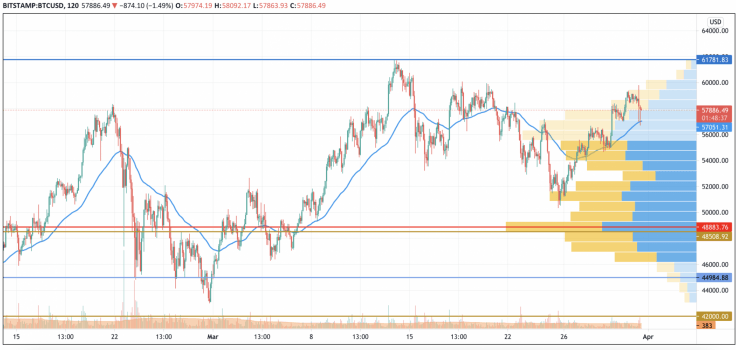
Yesterday morning, weak support around $57,100 halted the decline in the price of Bitcoin (BTC) and the bulls resumed their attempts to overcome the resistance of $58,000. In the first half of the day, the price recovered to this key level and consolidated above it. During the day, the bulls intensified the onslaught, as a result of which the daily maximum was fixed at around $59,380. At the end of the day, the trading volume decreased and the pair found support at the level of $58,400 and consolidated sideways until morning.
BTC/USD chart by TradingView
Judging by the short pullback, today the bulls intend to continue the recovery of the pair to the area of the monthly high. However, since last week, the recovery has not been supported by large volumes. If this trend continues on the last day of the month, then the bulls will not have time to get to the March high.
Another obstacle on the way to renewing the high is psychological resistance at the level of 60,000 USD. This level has already turned the pair into a rather deep retracement several times. There is no firm confidence that today bulls will be able to break through bears’ defenses and gain a foothold in the maximum zone.
At the same time, a rather powerful bullish impulse from a large buyer is capable of breaking through the psychological level of $60,000 and renewing the absolute maximum in the area of $62,100 in early April.
Bitcoin is trading at $57,800 at press time.
ETH/USD
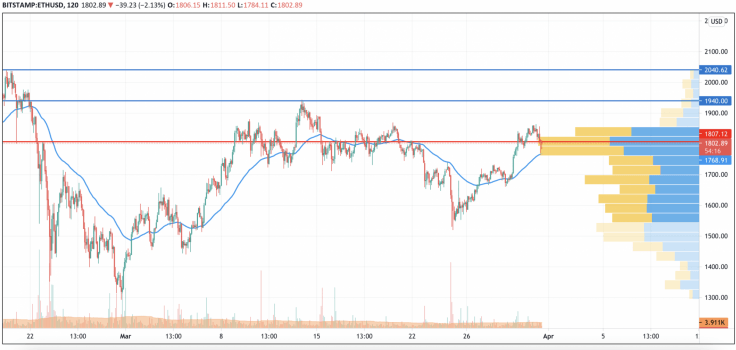
Yesterday morning, the sales volumes were rather small, so the pullback of the Ether price was not deep. Buyers found support around the POC line and tried to restore the price to the upper border of the channel.
ETH/USD chart by TradingView
By the end of the day, the pair was able to test the resistance at 1,860 USD, which has kept the price of Ethereum (ETH) in a sideways range until this morning. If bulls are able to increase buying volumes, then today they would update the March high around the $1,950 mark. If the upper border of the channel keeps the pair in a sideways range, then the price will roll back to the two-hour EMA55.
Ethereum is trading at $1,805 at press time.
XRP/USD
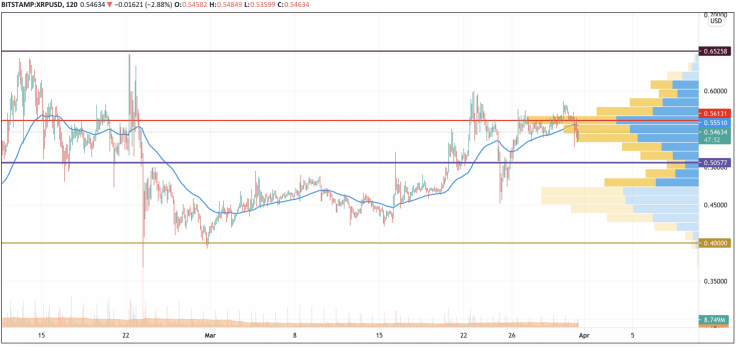
Yesterday, the XRP price failed to break above the level of $0.580 and, at the end of the day, returned to the level of $0.560. The lack of pronounced recovery dynamics in the pair above the $0.60 resistance could trigger a pullback below the two-hour EMA55.
XRP/USD chart by TradingView
Strengthening the positions of sellers in the market may lead to a fall in prices below the psychological mark of $0.50.
XRP is trading at $0.5458 at press time.
BNB/USD
Binance Coin (BNB) is the coin growing the most today. The native exchange coin has not gone down so much after a sharp dump of the market.
BNB/USD chart by TradingView
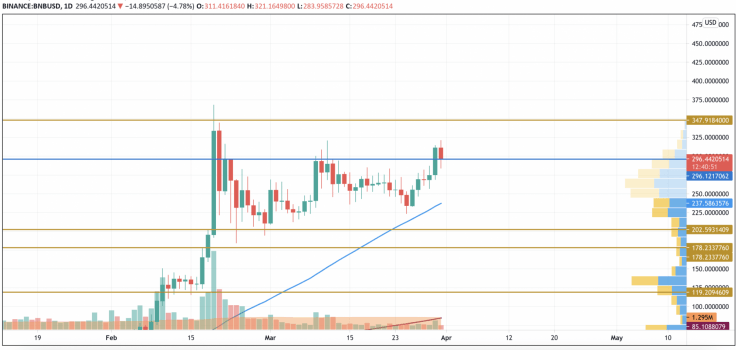
Despite the decline, Binance Coin (BNB) is still located in the bullish trend. The bearish scenario will be relevant if bears fix below $295 on the daily chart. However, the current value is likely to be considered the greatest of the mirror level. All in all, there is a chance of seeing BNB around $350 soon.
BNB is trading at $297 at press time.
UNI/USD
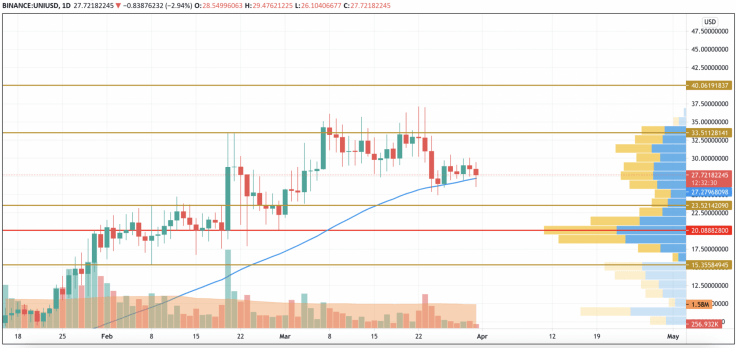
Meanwhile, Uniswap (UNI) is the top loser today as its rate has declined by almost 3% over the last day.
UNI/USD chart by TradingView
From the technical point of view, Uniswap (UNI) remains in the same place as a few days ago. The asset is located in the accumulated phase, which means that further growth will become relevant when bulls fix above $33.50.
UNI is trading at $27.7 at press time.
DOT/USD
Polkadot (DOT) is another so-called gainer as the rate of the Defi token has not gone down as the other altcoins have. Moreover, the altcoin has shown a rise of 1% over the last 24 hours.
DOT/USD chart by TradingView
Polkadot (DOT) is showing a much greater correction after today’s dump than the other coins. The selling volume remains low and the lines of the MACD indicator are about to enter the green zone, which will confirm ongoing bullish power and the potential to retest the peak at $42.
DOT is trading at $36 at press time.
ADA/USD
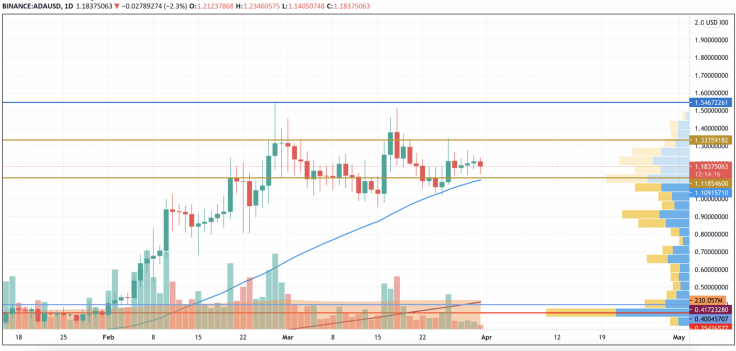
Cardano (ADA) is the second biggest loser today. The rate of the coin has decreased by 2% since yesterday.
ADA/USD chart by TradingView
On the daily time frame, Cardano (ADA) is trading similarly to UNI as neither bulls nor bears are dominating at the moment. In this regard, the rise is possible when ADA fixes above $1.40.
ADA is trading at $1.18 at press time.

