- Litecoin price hinting steep correction as TD Sequential indicator presented sell signal for 5th time in last five months.
- Supporting the bearish thesis are declining whale holdings, which increase the probability of a downswing.
- An upswing could come into the picture if LTC bulls manage to push past the recent high at $230.
Litecoin price has seen a 20% correction after hitting a local top on February 14. This correction shows signs of an extension as both technical and on-chain indicators have turned bearish.
Litecoin price primed for a downswing
Litecoin price saw a 100% impulse wave after bottoming on January 27. Now, the local top on February 14, signals the end of this rally.
On February 16, the Tom DeMark (TD) Sequential indicator flashed the fifth sell signal in the form of a green nine candlestick since October 2020.
Since this technical formation forecasts a one-to-four candlestick correction, previous sell signals have resulted in a 20-to-40% correction.
Hence, investors must assume that the recent bearish indication might follow through.
LTC/USDT 1-day chart
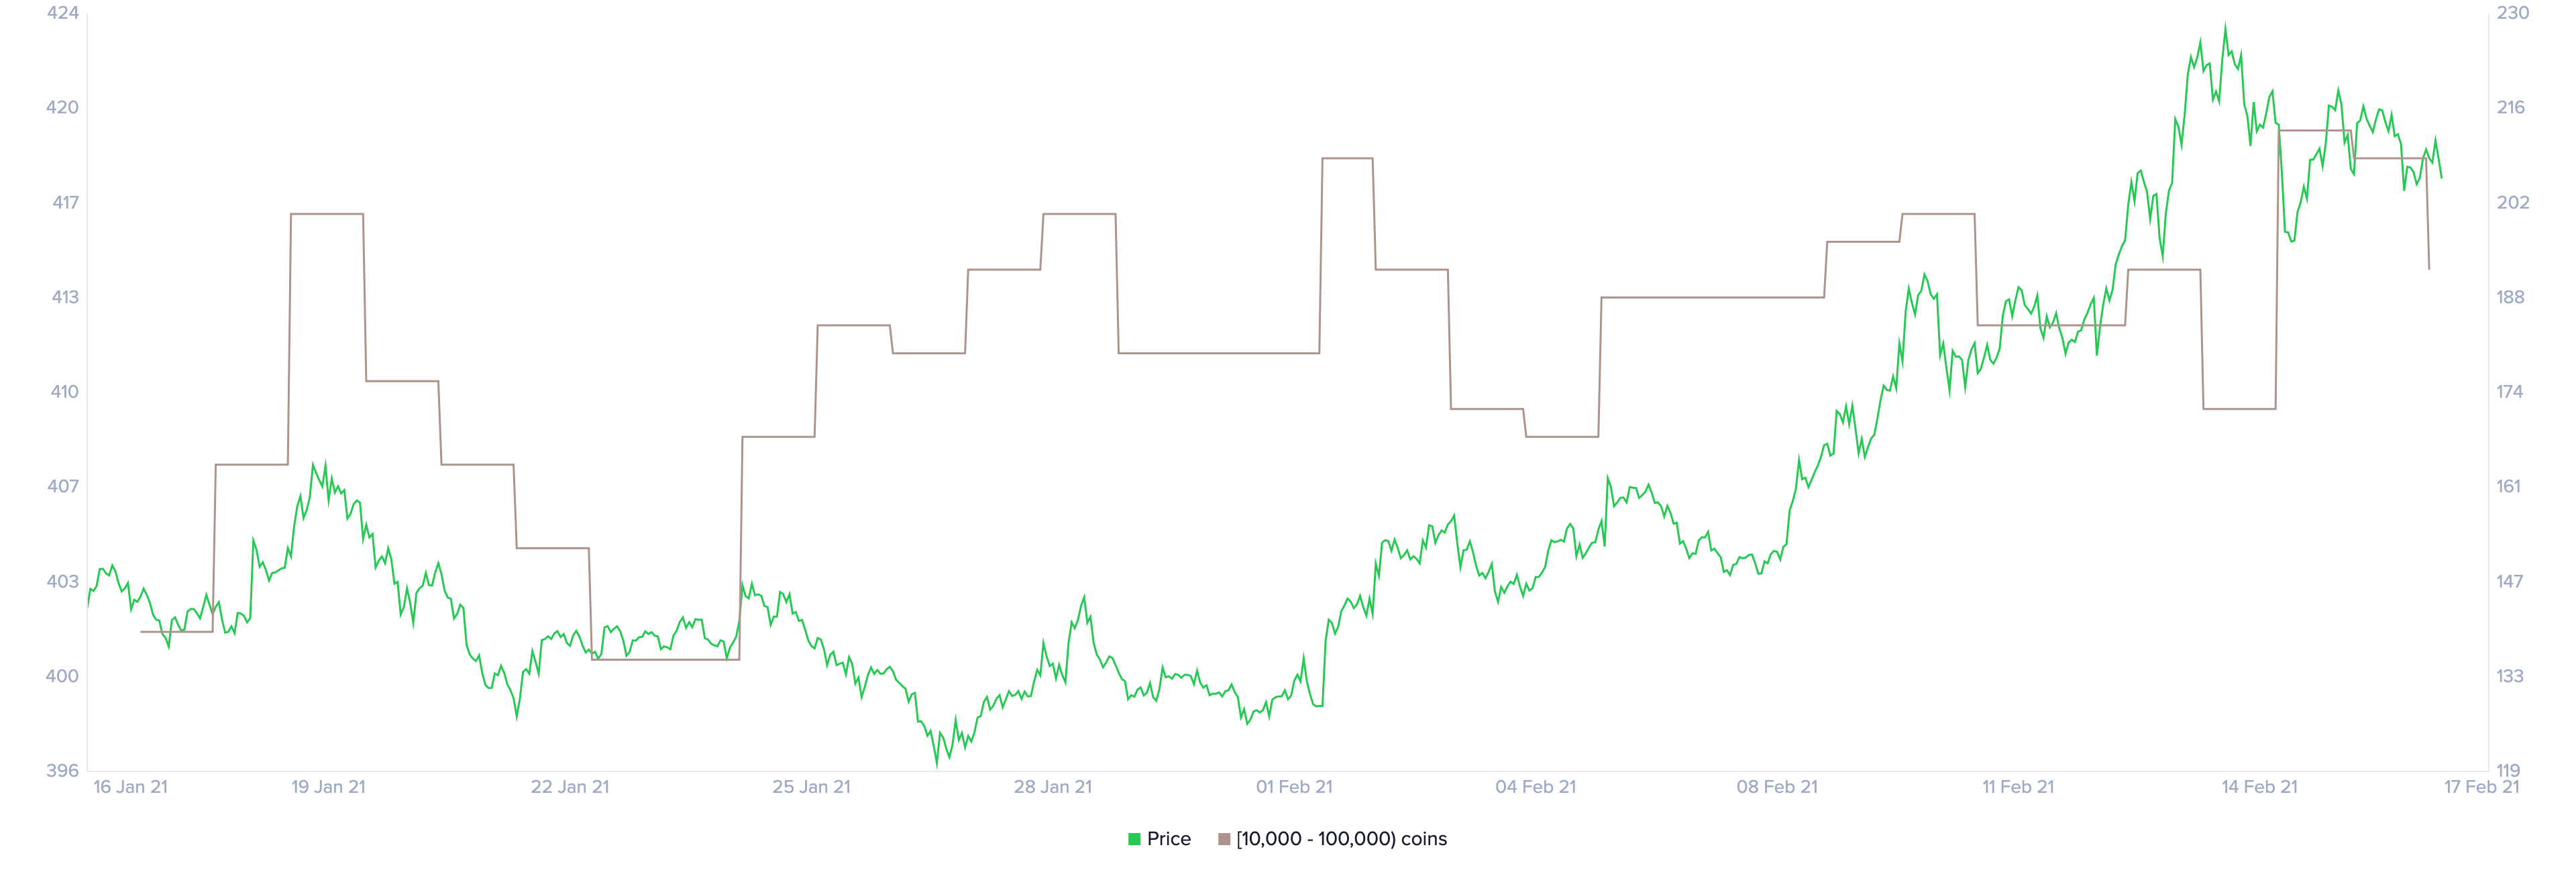
Adding credence to Litecoin’s bearish thesis is the declining number of whales holding between 10,000 to 100,000 LTC.
These whales have reduced from 420 to 415 between February 15 and 17 thus painting investors’ pessimistic outlook of Litecoin’s bullish potential.

Litecoin holder distribution chart
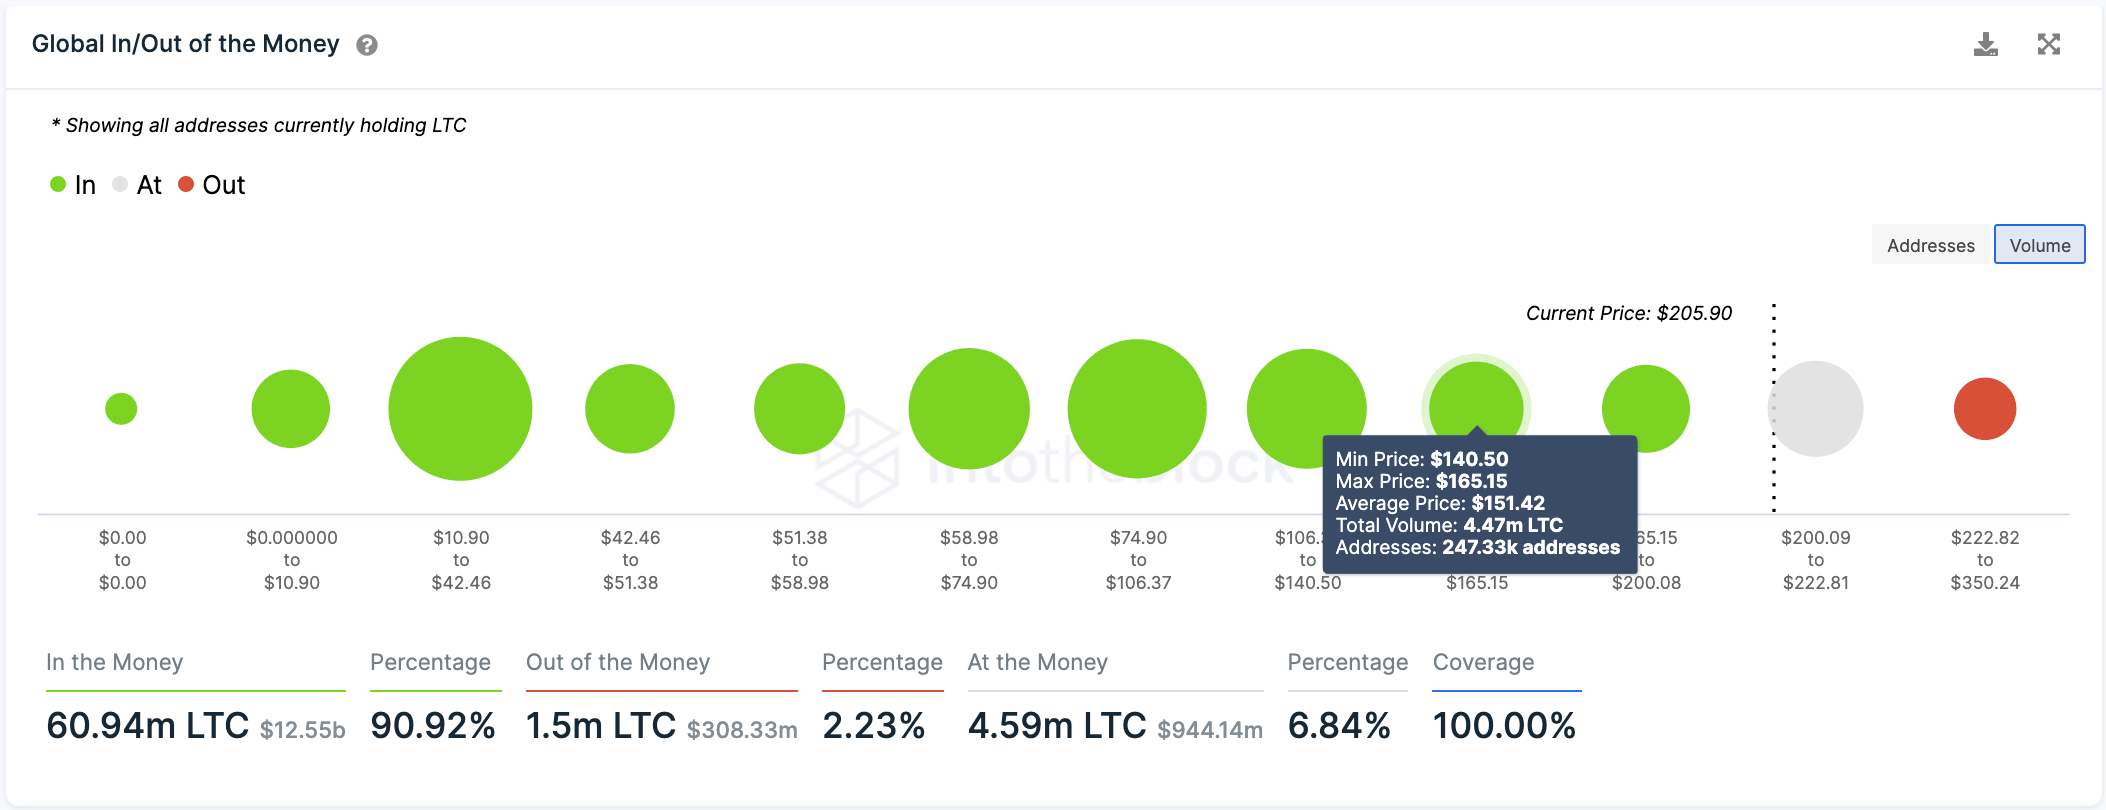
Litecoin’s downswing could extend up to the critical support at $150, which is a 30% drop from its current price.
Based on IntoTheBlock’s Global In/Out of the Money model, about 247,000 addresses purchased nearly 4.45 million LTC here.
Subsequent selling pressure leading to a breakdown of this support could trigger a sell-off pushing the altcoin to $130.

Litecoin GIOM Chart
While the bearish scenario seems likely and inevitable, it could be invalidated if LTC bulls manage to get a daily close above the recent high at $230.
If this were to happen, retail FOMO could push the coin up to $350 or the 161.8% Fibonacci level.
