The calendar turning to October hasn’t changed a whole lot for crypto price trajectories. Bitcoin and Ethereum have slid mildly, and altcoins (outside outliers like QNT, XRP, HT, and MKR) have mostly been in a bit more pain.
Social volume is also down, and crypto enthusiasts continue to drop out as the patience of traders’ hoping for a 2021 rebound continues to be tested.
Crypto Investors Grow Concerned
CPI and PPI data were released last week, indicating some further inflation and recession concerns. We immediately saw an expected market slide on both the crypto and equities sectors as a result, which has been the case throughout each piece of data that made the FOMC likely to increase interest rates.
What was not so expected was the very rapid rebound that caught shorters off guard. After Bitcoin was dumped to $18,300, it looked as if there was another wave of pain coming for crypto hodlers and traders…

But just as panic was settling in, both crypto and the S&P 500 rebounded almost instantaneously. Bitcoin price has mainly hovered between $18,800 and $19,600 ever since, and we’re now beginning to see calls for $20,000 once again.
A break away from this long-term correlation with equities would be a great sign for cryptocurrencies.
Is the Bitcoin price close to a bottom?
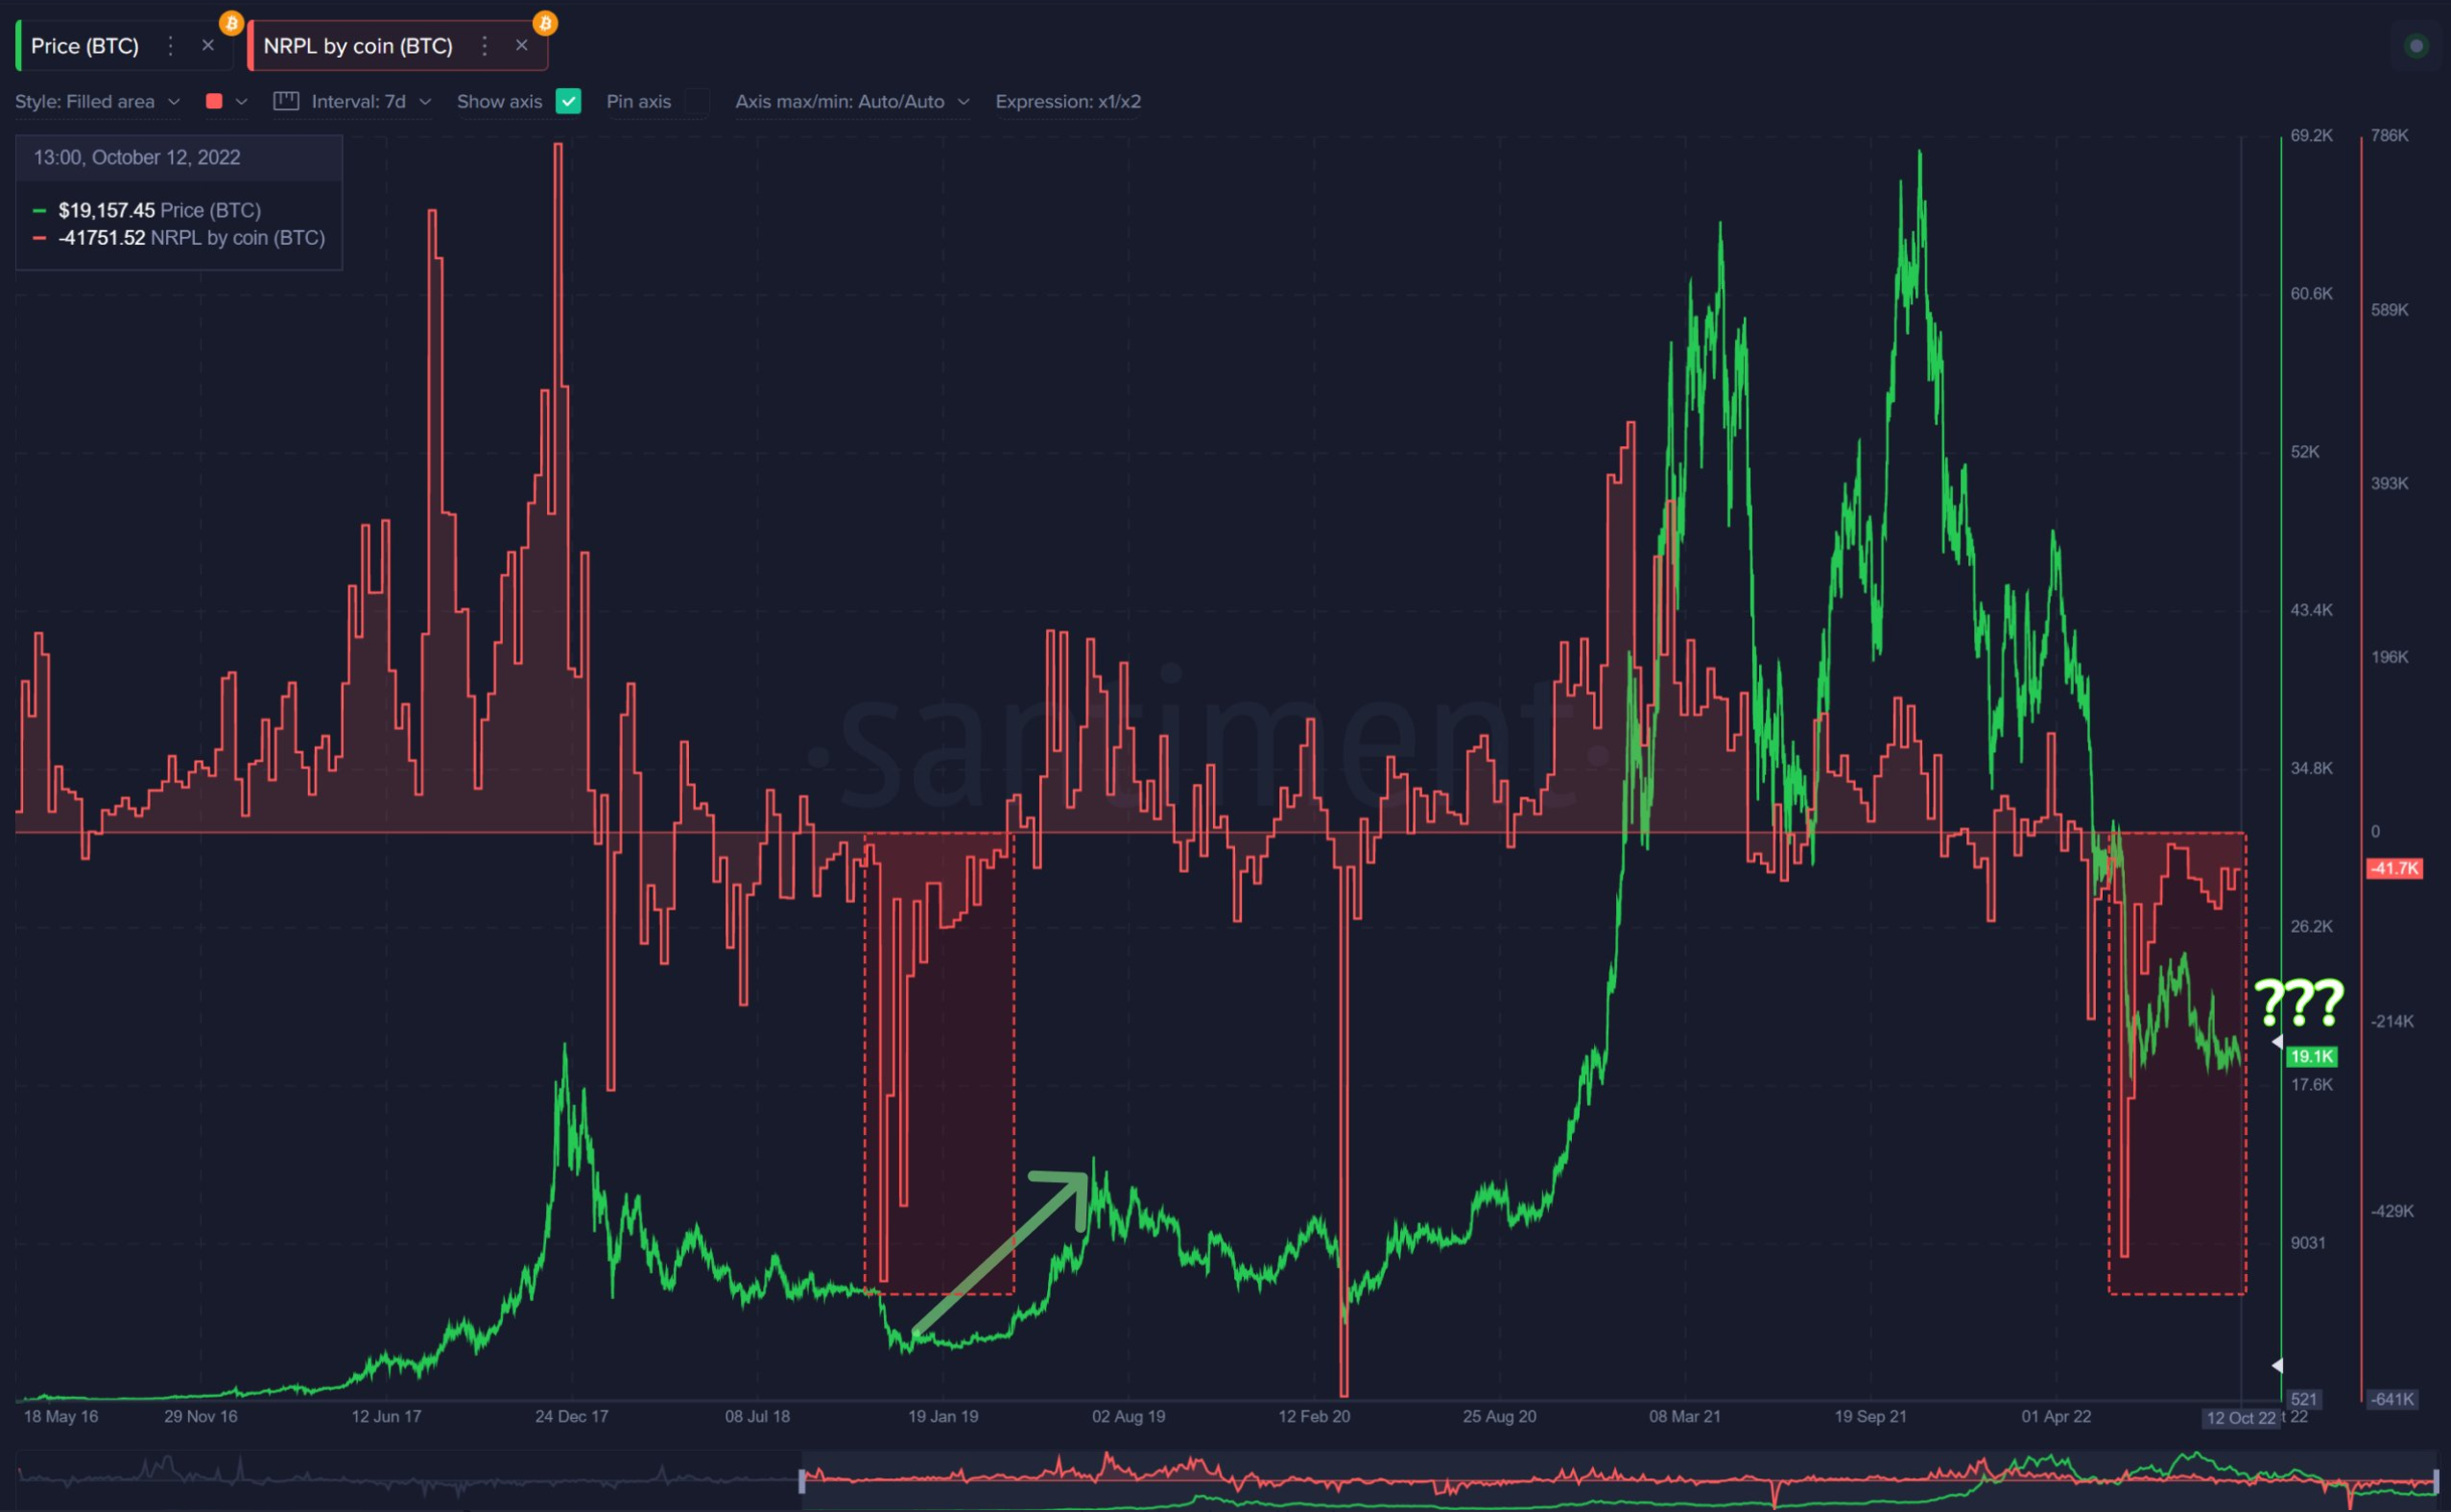
A fascinating trend that our team picked up is the Network Realized Profit Loss similarities between now and the turn of 2018 and 2019. From mid-November to mid-December 2018, Bitcoin price (along with most prices in crypto) plummeted by -49%. This, as you can imagine, caused major realized losses across the network. The biggest plummet we had seen up to that point relative to price.

Quite similarly, 2022 saw a plummet of -52% to Bitcoin price between May 3 and June 17. And since this time, an eerily similar realized loss spike (relative to price) showed up on BTC network. For the four months since, this NRPL/Price metric has stayed negative, just as we saw going into January 2019. History favors a rise under this kind of pattern. Will it repeat itself?
Bitcoin and Tether whales aren’t convinced that it’s time to jump back in yet, according to Santiment’s Supply Distribution data:

Addresses holding 100 to 10,000 BTC (represented by the yellow line) are still holding around 45.7% of the asset’s overall supply after holding 49.5% about one year ago. This 3.8% drop in holdings has been key to Bitcoin price failing to recover after hitting its early November 2021 all-time high.
And Tether addresses (represented by the pink line) holding $100,000 to $10,000,000 are not showing much more enthusiasm. They held close to 59% of USDT nearly two years ago and now hold a staggering 29%, meaning they have dropped slightly more than half of their supply. Not quite the confidence from major stakeholders that we are hoping for.
BTC and ETH selling pressure wanes
But back to encouraging news – we see that both Bitcoin (in blue, below) and Ethereum (in mauve, below) really haven’t seen a significant week of profit-taking since mid-September. This was, of course, the week of the ETH merge, which caused a ton of volatility throughout the markets.

Major high spikes in the above chart historically lead to prices dropping as the effects of profit-taking come in. Meanwhile, major low spikes are more indicative of bottoms as traders capitulate and weak hands drop out, opening the door for larger volume traders to swoop in and buy their abandoned coins at lower prices. Both BTC and ETH, as we can see, have stayed neutral or negative over the past month. That is a promising sign.
One thing, however, we’d still like to see improvements on for ETH, just like we covered for BTC, are the key stakeholders and their lack of accumulating. Look at the tale of two halves over the past three months:

During Ethereum rise against Bitcoin price, we saw that shark and whale addresses holding 100 to 1,000,000 ETH had accumulated a combined 2.2M Ethereum. During this time, ETH/BTC rose by +43%.
However, since right before the ETH merge, these same addresses have been dumping the supply in a huge way. 3.3M Ethereum has moved away from these addresses, and ETH/BTC is shedding its gains in unison.
For the many who believe in Ethereum, a lot will be riding on how these key ETH addresses decide to behave between now and the end of the year.
Crypto market: trading behavior
And in terms of other trader behavior, our Sansheets models are showing some bias toward shorting for most of the current week thus far. Both the funding rate of BTC (in blue) and an average of the top 150 altcoins (in purple) have been favoring betting against the markets for much of October. As long as this is the case, prices have a better chance of rising (and liquidating these shorts) than they do falling.

And finally, keep an eye on whale transactions right now. The higher the bars below, the closer altcoin $100k+ transaction counts are to their respective three-month highs. And when we see major anomalies in whale transactions, it usually indicates at least a temporary price turnaround. ANKR, BAT, GALA, and QNT are among some altcoins seeing major transactions happening at the time of this writing!

Metrics point to reasons to be more optimistic than we’ve been able to be in a while. But 2022 has been a year of being fooled many times over. What will really trigger the next bull run is when optimism no longer exists, and a bearish narrative is the overwhelming majority of our timelines and suggested videos.
Disclaimer
All the information contained on our website is published in good faith and for general information purposes only. Any action the reader takes upon the information found on our website is strictly at their own risk.
