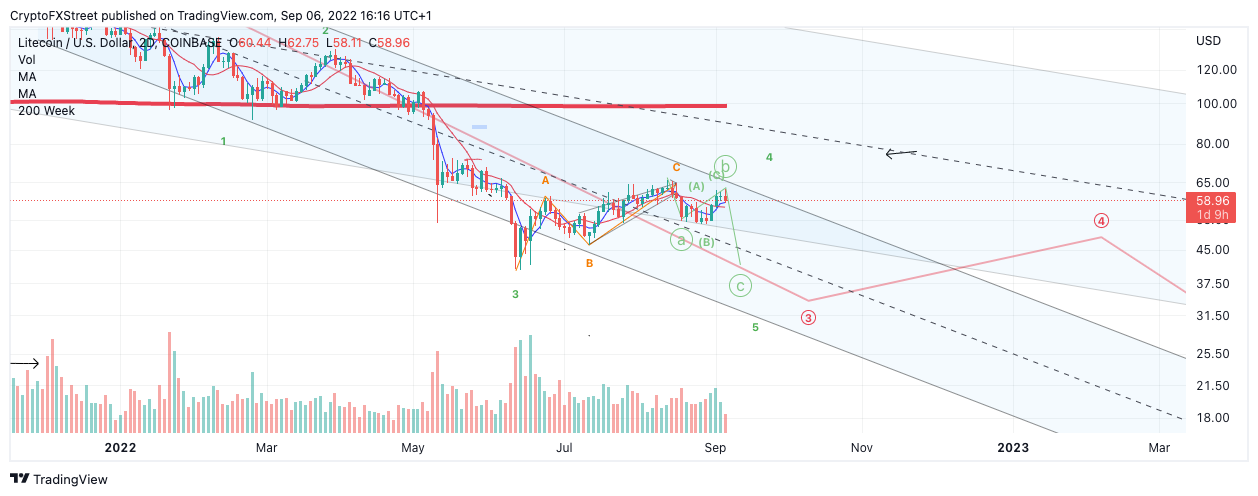
- Litecoin price hovers within a descending parallel channel.
- The 200-week moving average is currently 65% above the current market value.
- Key levels have been identified for both a bearish and bullish scenario.
Litecoin price is inching towards a breakout, but jumping in too soon could result in a whirlwind of pain.
Litecoin price bullish scenario
Litecoin price currently trades at $58.78 as the bulls and bears collide on smaller time frames. Although the Litecoin price has witnessed significant suppression from the bears throughout the summer, a reversal can always occur.
Litecoin price has breached both the 8- and 21-day simple moving averages, which confounds the idea that bulls are ready to retaliate. Additionally, there is an uptick in volume amidst the recent breach.
LTC USD 4-Hour Chart Bullish Scenario
If the bulls can produce a closing candle above $75, a rally towards $90 at the 200-week moving average will be in the cards. Such a move would result in a 65% increase from the current market value.
Litecoin price bearish scenario
Litecoin price still has significant boundaries to cross before confidence starts pouring into the market. Litecoin price has not provided a clear five-wave impulse since the June 18 crypto selloff. Additionally, the largest 2-day candle dating back to December 3, 2021, remains unchallenged in size.
Litecoin price will need to stabilize above the 8- and 21-day-SMA’s without waking up sleeping bears. Any close below the indicators could provoke a bearish cross and prompt institutional traders to join in for a quick profit.
LTC USD 2-Hour Chart Bearish Scenario
A closing candle below $56 on the 2-day chart could catalyze a plummet into the $30 price zone, resulting in a 48% decrease from the current Litecoin price.
In the following video, our analysts deep dive into the price action of Litecoin, analyzing key levels of interest in the market. -FXStreet Team

