Litecoin price had been staggering too, just like other major altcoins in the market. Over the last 24 hours, however, LTC moved up on its chart by 2.4%.
The bulls have yet to steady themselves on the one-day chart. Over the last week, LTC gained almost 3%. This indicated that the coin has not made any such considerable movement on its chart.
The bears were in charge of the altcoin, as indicated by the technical indicators. There is a significant immediate resistance for the Litecoin price to overcome.
The buyers were low in the market, and that has tired the bulls out consistently. At the moment, the coin has found support near the $51 price mark.
Because selling strength was greater than buyer strength in the market, the Litecoin price may not stay above that level for long.
On the other hand, if buying strength stabilises slightly, then there is a chance for LTC to move above $56. Broader market strength will be crucial for Litecoin over the next trading sessions.
Litecoin Price Analysis: One Day Chart
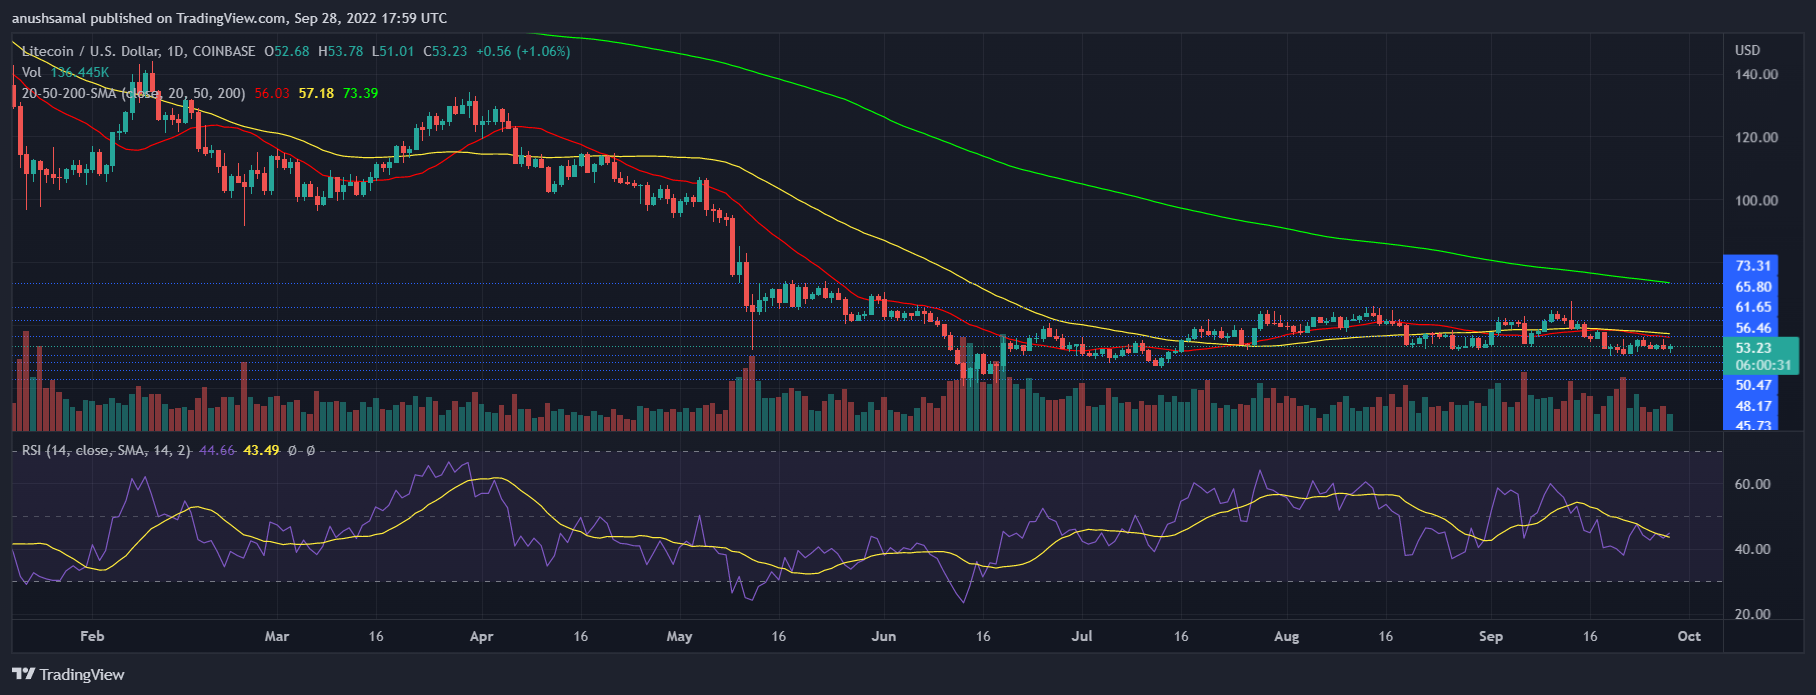
LTC was trading at $53 at the time of writing. Litecoin price will witness tough resistance at the $56 price mark.
The bulls have moved closer to that price mark each time, but it has met with selling strength. Moving above the $56 price mark could help Litecoin price invalidate the bearish thesis.
The coin could experience a price ceiling at the $61 price mark. On the other hand, the support line rested at $51 and then at $43, respectively.
The amount of Litecoin traded in the last session declined, which indicated that buying strength remained low on the 24-hour chart.
Technical Analysis

LTC’s indicators continued to display that the coin was in a downtrend. The sellers remained in control of the charts, which could potentially bring the coin down to $51.
If buying strength doesn’t recover soon, LTC could move to $51 before it recovers on the chart again. The Relative Strength Index was below the half-line, which meant that sellers were more compared to buyers.
Litecoin price was below the half-line, which meant less demand for the coin. It also meant that sellers were driving the price momentum in the market.

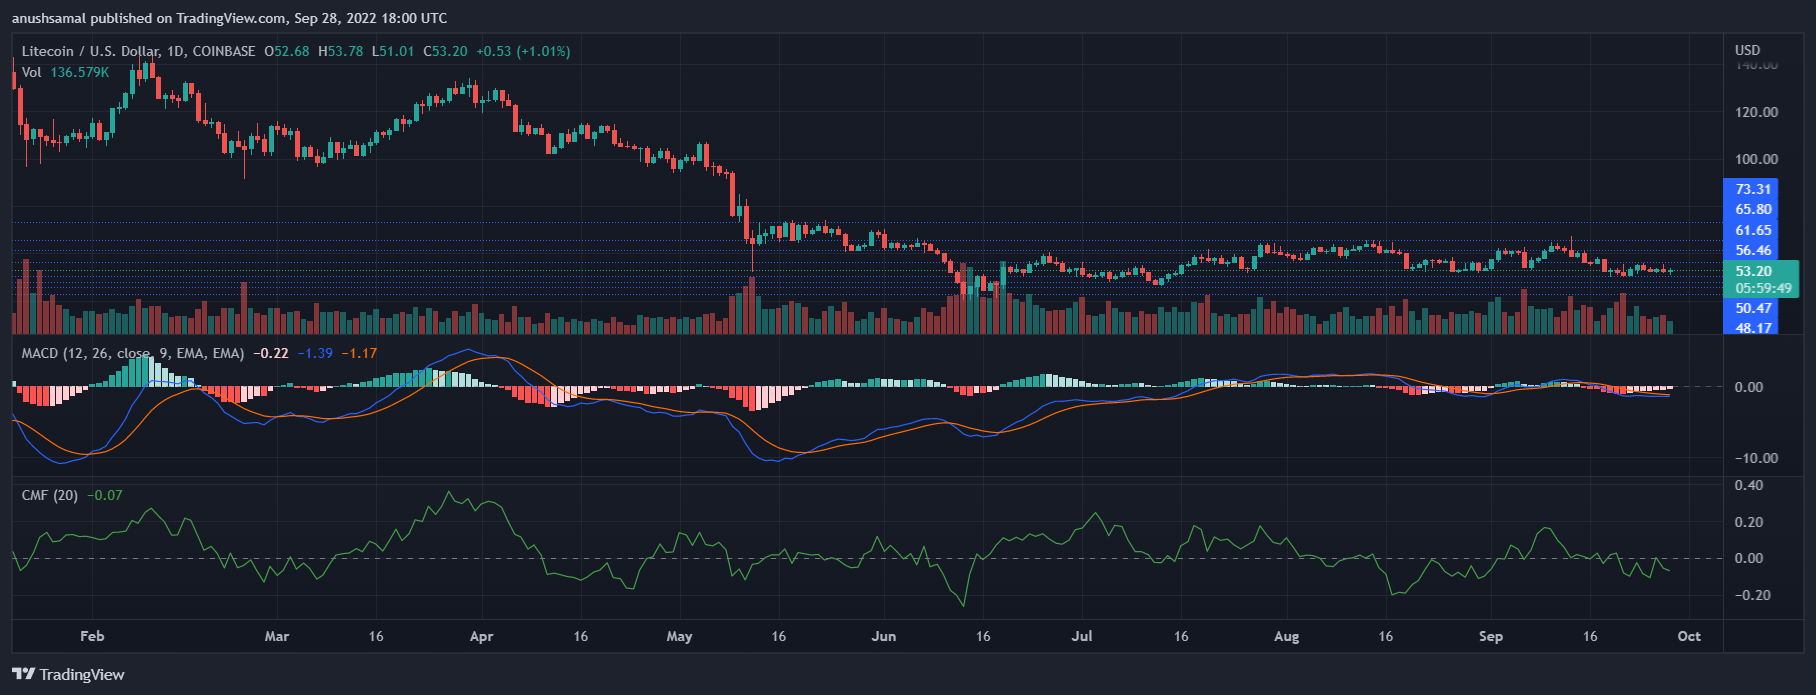
The altcoin continued to paint a bearish picture, with sellers taking over on the one-day chart. The Moving Average Convergence Divergence indicates the price momentum and action.
MACD displayed red histograms, which were a sell signal for the coin. The Chaikin Money Flow measures the capital inflows and outflows in the market.
CMF was below the half-line, which meant that capital inflows were lower than outflows on the one-day chart.
