- Bitcoin price breached a crucial barrier and points to lower targets in the short term.
- Ethereum’s newfound high counterbalances previous RSI divergence.
- Ripple continues to show uptick in transactions and volume with little directional bias to show for it.
The crypto market is edging near catastrophe, but the catalyst makers have yet to be triggered. Either sell-off comes soon, or smart money will continue liquidating early bears.
Bitcoin price is almost there
Bitcoin price shows reasons to believe in an upcoming sell-off. Since July 1, the BTC price has ascended 33% in a jagged fashion. The turbulent ride created a coiling edge-like pattern that prompted higher lows and lower highs throughout July. Now the bears have established a daily closing candle outside the wedge, which could be the early evidence of an upcoming reversal.
BitcoinI’m price currently auctions at $23,411. The peer-to-peer digital currency has shown a slight uptick in volume amidst the trendline breach, while Relative Strength Index has displayed several bearish divergences during the summer. Additionally, the bears have established a breach through the 8- and 21-day simple moving averages. The last marker BTC price will need to justify opening a short position is a breach below $23,125 (as mentioned in previous outlooks).
Invalidation of the downtrend scenario (providing that $23,125) is a breach above $26,800. The bearish targets are $20,916 and potentially $18,400, up to a 20% decline from the current BTC price.
BTC/USDT 1-Day Chart
In the following video, our analysts deep dive into the price action of Bitcoin, analyzing key levels of interest in the market. -FXStreet Team
Ethereum price is not there yet
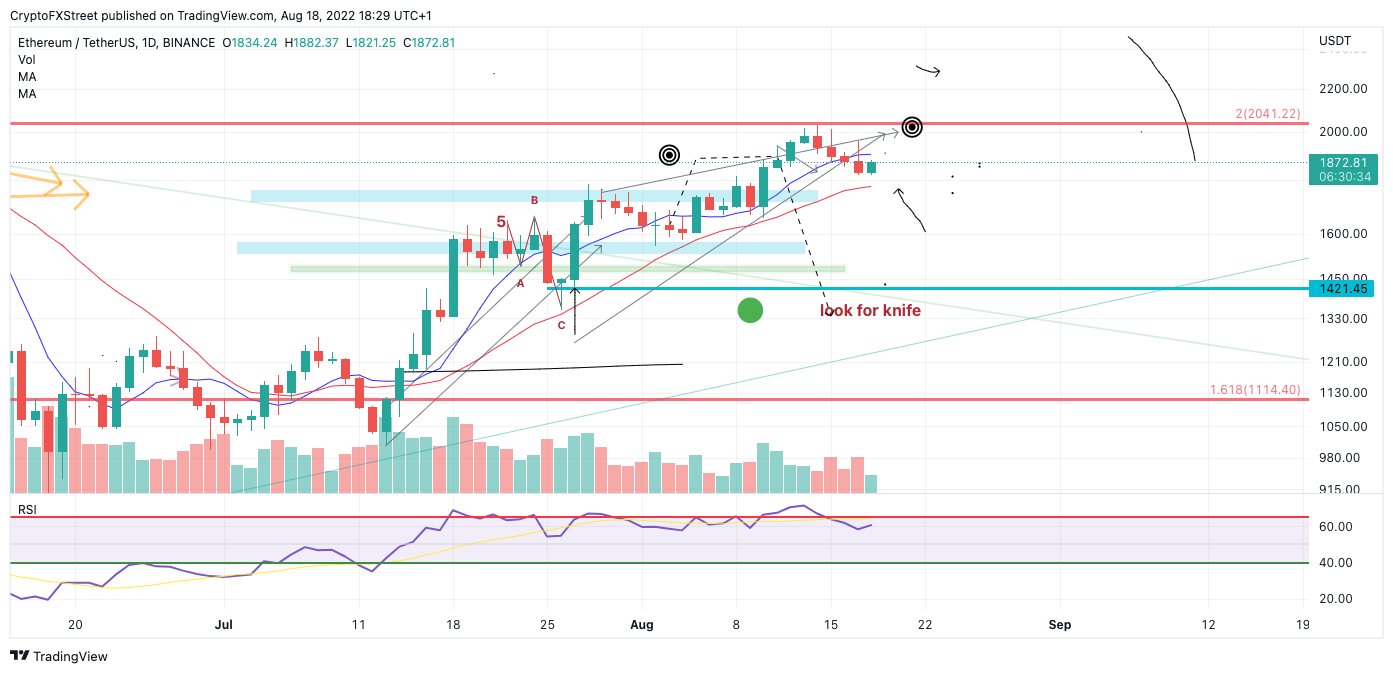
Ethereum price is on the border of an anticipated decline. Still, bears looking to enter the market should be cautious as the smart contract token has not yet pinned the nail in the coffin for the uptrend’s demise.
Ethereum price currency trades at $1,862. The Volume Profile has consistently tapered, signaling retail traders’ ambition to send prices lower. Although the Relative Strength Index displayed bearish divergences throughout July, the new high established at $2,030 counterbalances the bearish pressure and could prompt an additional high towards $2,159.
Still, the anticipated short is a possibility. A breach at the $1,754 level could trigger a sharp decline targeting $1,420. Such a move would result in a 25% decline from the current Ethereum price.
ETH/USDT 1-Day Chart
In the following video, our analysts deep dive into the price action of Ethereum, analyzing key levels of interest in the market. -FXStreet Team
XRP price could shake out bulls again
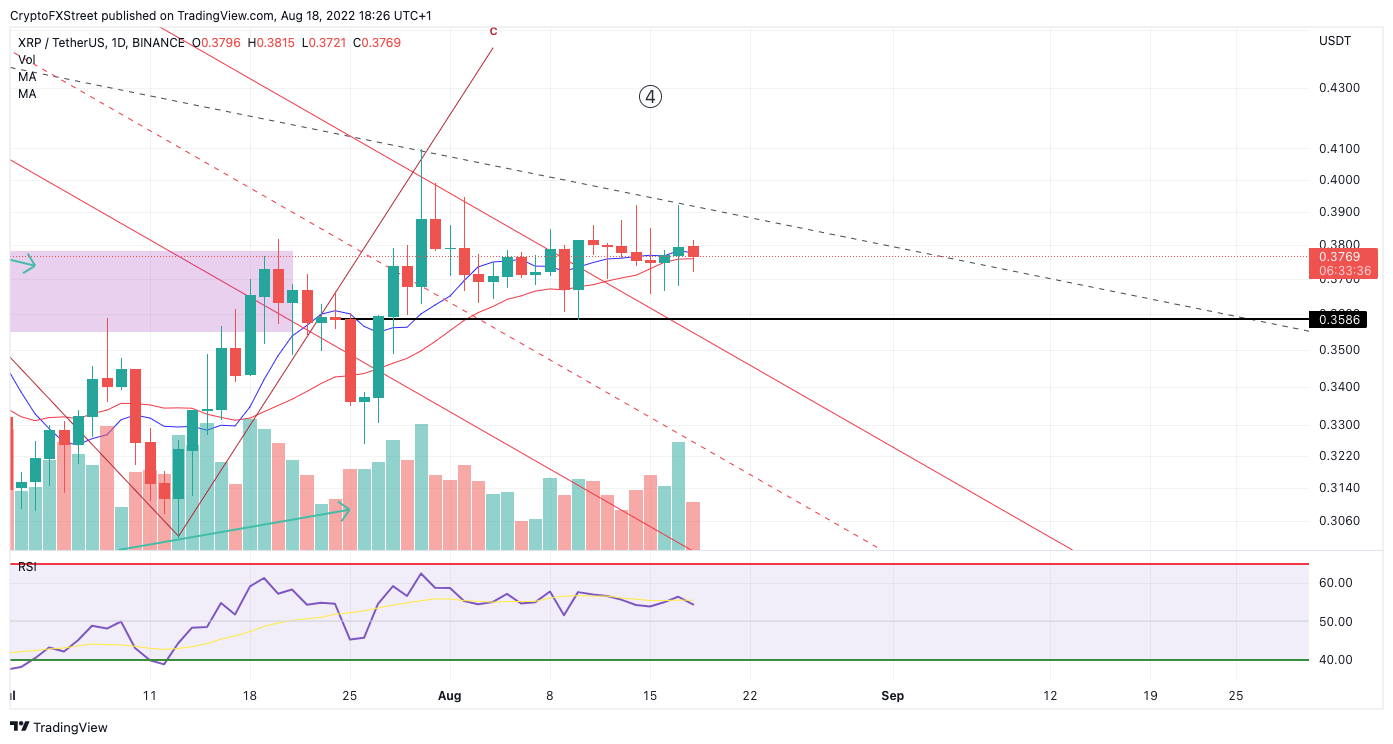
XRP price shows thought-provoking during the third trading week of August. A very peculiar influx of volume has recently come in as the digital remittance token continues to hover above a crucial descending trend channel. The XRP price saw barely any movement amidst the increased transactions, which dictates the question, who’s buying and who’s selling?
XPR price currently auctions at $0.3764. An on-chain analysis recently showed an uptick in transactions for the XRP price last week. Historically, large spikes of user activity have resulted in 15-20% sell-offs in the past. Thus traders should be very cautious about getting involved with the XRP price.
Santiment’s Daily Active Wallets Indicator
A breach above the July 30 swing high at $0.41 should be the catalyst to provoke a 20% rally towards $0.48.
On the contrary, if lows married at $0.3586 are breached, massive liquidation could target $0.29, resulting in a 20% decline.
XRP/USDT 1-Day Chart
In the following video, our analysts deep dive into the price action of Ripple, analyzing key levels of interest in the market. -FXStreet Team


