gremlin
While Coinbase’s (NASDAQ:COIN) stock price plummeted over -89% from an All-Time High (ATH) to its lows, many like to compare the current broader market drawdown, including S&P 500 and Nasdaq, to the dot-com bubble burst and Pets.com in 2000. Is the analogy even valid? Coinbase is far from collapsing and repeating Pets.com’s doomsday. Coinbase continues to generate over $1B in revenue even during a tremendous downturn due to macroeconomic headwinds, equity market sell-off and cascading deleveraging and downward pressure in the crypto market. A significant difference exists between the Coinbase business’ resilience and Pets.com. Pets.com had $6M in revenue and went from start to IPO, then bankrupt within exactly two years. Nonetheless, the current macro environment is very challenging, and undoubtedly, the Coinbase valuation and multiples were over-extended in the 2021 bull cycle with mismatched growth expectations.
Crypto brief – four-year cycle
Investors should understand the crypto market’s cyclical and parabolic nature that inevitably affects crypto-related business. It’s not a defect in the business; it’s a feature and path of the crypto market, often dominated by the leading cryptocurrency Bitcoin’s (BTC-USD) economic design and early adoption cycles, which tend to be less stable. BTC remains in its infancy of becoming the global decentralized monetary network and system despite going through a 13-year historical evolution during numerous downturns and three major bear cycles. Essentially, its highly decentralization, secure cryptographic algorithm and economic design is part of its design and innovation. BTC has a maximum supply of 21M coins based on a non-inflationary framework.
Another important dynamic is the Bitcoin Halving process. This process involves halving the rewards to miners after each 210,000 blocks are mined until all 21M coins are mined (around 2140). Based on the mining pace and past data, this occurs in four-year cycles; however, this is not a fixed schedule. This results in supply squeeze and price spikes because reducing rewards to miners essentially reduces the supply of new coins in circulation. Back in 2009, when BTC first launched, miners received 50 BTC per block mined. The table shows the history of the BTC Halving and the effect on price.
|
BTC halving history |
||||
|
New BTC per block before halving |
New BTC per block after halving |
Price on Halving day |
Price 150 days later |
|
|
Nov 28, 2012 |
50 BTC |
25 BTC |
$12.35 |
$127.00 |
|
Jul 9, 2016 |
25 BTC |
12.5 BTC |
$650.53 |
$758.81 |
|
May 11, 2020 |
12.5 BTC |
6.25 BTC |
$8,821.42 |
$10,943.00 |
|
2024 |
6.25 BTC |
3.125 BTC |
N/A |
N/A |
These past results don’t guarantee the future, especially with BTC, where there is growing correlation with the macroeconomy and equity market and the change of dynamic during ongoing evolution and adoption. Nonetheless, in the past 13 years, the four-year rolling returns of BTC have been positive and proven to be profitable for investors. The chart below shows the sharpe ratio trending up after BTC halving. Hence, investors should keep a longer time investment horizon in mind.
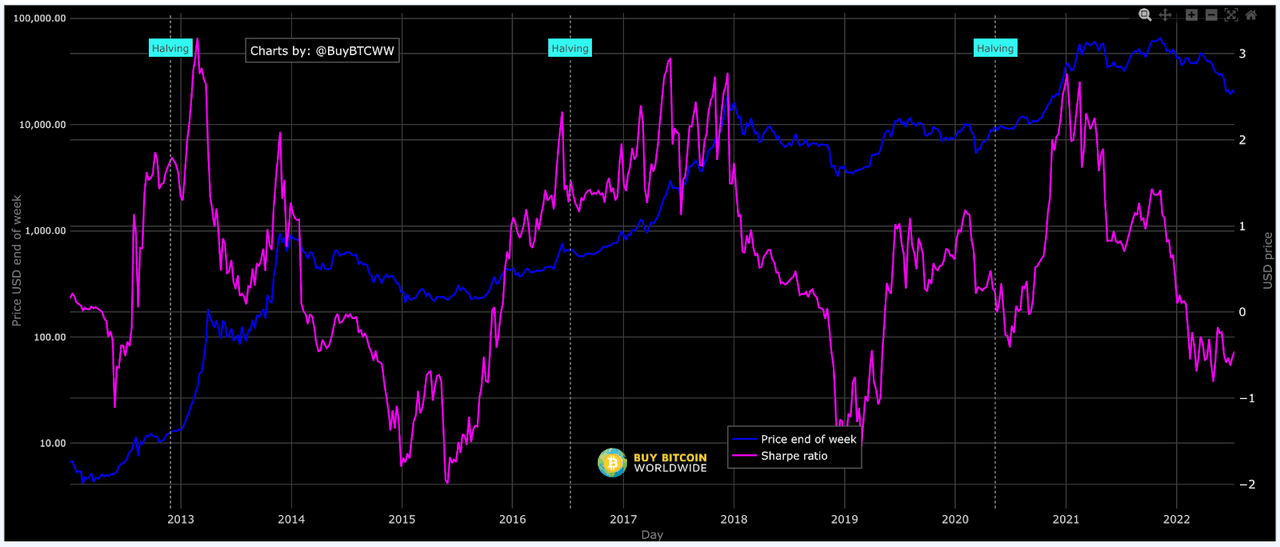
BTC Sharpe Ratio (Buybitcoinworldwide)
Understandably, the sentiment is low as witnessed in the sell-off in one of the all-time favorite blue chip high-growth stocks, Apple. But would the crypto market go to zero? Not all will survive, but BTC has a proven track record of enduring the downturn and recovery. Anecdotally, BTC’s network effect is growing stronger compared to Facebook that has an aging demographic audience and diminishing active users.
In 2017, there weren’t any publicly-traded companies putting BTC on their balance sheets. But in 2021, 27 companies including BTC, such as Block (formerly Square), Tesla, MicroStrategy, and more services support crypto including PayPal and Shopify. In total, 216,666 BTC worth $15 B at its peak in November 2021, are held by public companies. Additionally, the demand side strengthens with the entry of institutions and macro traders on Wall Street, and the pattern of volatility shifts from less predictable to highly correlated with risk assets and the equity market.
Coinbase business fundamentals
Balance sheet and cash flow
Overall, Coinbase built a solid foundation and has survived two big crypto bear cycles in 2013 and 2017. Coinbase has also built a strong balance sheet and cash positions year-over-year. While the bull run pulled forward the growth for Coinbase in 2021, followed by a deep downfall, the upcycle allowed the company to grow the cash and equivalents from roughly $1B in December 2020 to $6.1B in March 2022. This enables Coinbase to weather the stormy market conditions and invest in long-term growth, including equity investment in innovative upstarts and opportunistic M&As at a compressed valuation during the downturn and consolidation phase.
However, the volatile and cyclical nature of the crypto market imposes difficulties for Coinbase and crypto-related companies to scale and grow without compromising profitability.
It’s expected that Coinbase will navigate this challenging environment on top of unprecedented macroeconomic headwinds with new optimization and improvement. These changes enable Coinbase to be in a better position with more efficiency, a better cost structure, and ability to sustain the up and down cycles and to stay consistently profitable. If Coinbase can take measurable steps to tighten the high-cost areas and crypto prices stabilize, Coinbase can get out of this bear market as they did during the 2013 and 2017 down cycles and shine on through 2021.
As mentioned before, Coinbase’s stock price dropped over -89% from an ATH and -82% from Jan 2022 to its low of $40.82. Meanwhile, with the Macro downturn and the overall crypto market drop, Coinbase’s revenue and trading volume remains steady around the Q3 2021 level. Based on the daily trading volume provided by CoinGecko and FTX volume monitor, the latest Coinbase daily trading volume can be tracked. The daily volume in April to June has further declined on average (approximately 2-2.5B daily) compared to Q1 (3-3.5B). Per the Q1 2022 shareholder outlook, Coinbase projected the total trading volume would be $74B, which aligned with CoinGecko’s data. However, critical events in the first half of May and June caused market and price volatility in crypto, which translated into volume spikes for a couple of weeks. Based on that trajectory, the approximated trading volume for Q2 (assuming 3B daily volume in May and 25% decline resulting in 2.25B daily volume in June) is illustrated below:
|
(in $billion) |
April |
May |
June |
total |
|
Monthly trading vol. |
74 |
90 |
68 |
232 |
Based on the average Retail-Institutional ratio of prior quarters, the split is about 0.3307. With the decline in retail trading, the ratio is adjusted by a decrease of -25%.
|
TRADING VOLUME ($B) |
Q2’22 |
|
Retail |
76.73 |
|
Institutional |
155.27 |
|
total |
232 |
Q2 revenue and earnings
Trading fees provide the main revenue source for most crypto trading exchanges. For Coinbase, they serve more institutional clients than most of its competitors. Also, Coinbase has other secondary revenue streams, including custodial and subscription fees. Despite this, the majority of the revenue is from retail trading fees.
The take rate for retail trading is about 1.2%, which accounts for the fees charged on both sides of a trade falling in the first pricing tier in the Coinbase fee structure.
On the other hand, the institutional trading fee is about 0.03% based on the high volume price tier. Additionally, the expenses can be estimated by using the projected trading volume and the forward guidance from Coinbase in Q1 Earnings shareholder letter and staff layoff data.
In sum, the estimated revenue for Q2 is $1.097B, a decrease of 5% compared to Q1. It’s expected Coinbase will trim some of the highest-expense areas, including HR and Marketing. These cuts will put the operating expenses at $1.294B, which represents a 25% decrease compared to Q1. This also results in an operating loss estimated at -$197.18M, or a decrease of 65% and net loss is -$174M (a decrease of 59.5% compared to Q1, giving an estimated EPS of -$0.8). If Coinbase cannot reduce operating expenses as much as 25%, the loss will be higher in Q2.
|
NET REVENUE ($M) |
||
|
Transaction revenue (in M) |
Q2’22 |
Remark |
|
Retail |
938.04 |
Based on the take rate, a 1.22% retail and 0.03% institutional was applied to the estimated trading volume per table above. |
|
Institutional |
45.19 |
|
|
Total transaction revenue |
983.22 |
|
|
Total Subscription and services revenue |
114.00 |
Based on the average of prior quarters. Q4’21 was excluded because it was skewed higher than usual volume |
|
Net revenue |
1097.22 |
|
|
OPERATING EXPENSES ($M) |
||
|
Transaction expense ($M) |
219.44 |
Transaction expense should be closer to Q3 during the downturn period with less trading volume |
|
% of net revenue |
20% |
Projected % from Q1 earnings outlook |
|
Sales and marketing ($M) |
180.18 |
|
|
% of net revenue |
10% |
Projected % from Q1 earnings outlook |
|
Technology and development ($M) |
443.83 |
22% decrease (approximate based on the decrease in headcounts below) |
|
General and administrative ($M) |
321.65 |
22% decrease (approximate based on the decrease in headcounts below) |
|
Other operating expenses, net ($M) – incl. crypto asset impairment charge due to price drop |
129.3 |
Assuming their crypto assets are rebalanced to reduce the impairment charge by 50% of the Q1 amount |
|
Total operating expenses ($M) |
1294.40 |
|
|
Full-time employees (End of Qtr) |
3,848 |
|
|
22.23% |
Decrease in headcount compared to Q1 |
|
|
Operating income (loss) |
-197.18 |
|
|
64.54% |
Decrease in loss |
|
|
Net income (loss) ($M) |
-173.9955993 |
Approximate based on decrease % and loss in Q1 |
|
Profit (loss) margin |
88.24% |
|
|
EPS |
-0.801 |
Approximate based on decrease % and loss in Q1 |
Source: Author, data from Coinbase’s Q1 Earnings shareholder letter
H2 of 2022 and moving forward
In terms of the second half of 2022, if BTC price declines further to the next support levels of $13-14K or jumps to $24-25K, this will entail a -30% downside to a +30% upside for Coinbase trading volume and revenue.
On the upside, the full year 2022 will generate approximately $587.92M net income and an EPS of $2.35, which represents a decrease of -84% compared to Y2021. On the downside, the year 2022 will result in a net loss of approximately -$425.53M and EPS of -$1.70. That would underperform the 2020 result, which had less than one-third of the revenue than 2022, even at the base case. One reason to consider is that it would be a challenge to abruptly trim back the cost while maintaining its business at its current size and scale.
While Coinbase has dominated and penetrated the US market (one of the largest and most strict regulations), another possible growth driver is international expansion, especially in the EU regions.
The web traffic and user data and comparison among Coinbase and its competitors on Similar Web provide some good insights. Coinbase has an average of 27.69m monthly visits in the US in May and 10.95m from major EU countries, including the UK, Germany, Spain and France. Growth should be evident in the EU, and the UK especially, which accounts for 3.16m visits. As evidence, there was a 15% increase in UK traffic in May. Unfortunately, Coinbase failed to launch in India and faced immediate government pressure and intervention.
Moving forward, as mentioned above, the crypto market and BTC normally go through an up and down four-year cycle, partly due to the four-year halving process. While it’s in a major pull-back and bear zone, likely given the recovery in the macro environment, equity market and some other positive development in crypto adoption and innovation, crypto and BTC price could bounce back before 2024 or after BTC halving.
Coinbase is a proxy investment to the crypto space if some are still not comfortable with direct investment in crypto. The one-year price chart below shows Coinbase’s stock price has a high correlation with the BTC price, yet the drawdown of Coinbase is 89% and BTC is 72%. When market recovers, with BTC back on the uptrend and breaking out from the bear market, BTC price will likely pull up to the prior ATH of $69K from the lows of $19K, representing a 260% increase (3.6x). Coinbase price will also have a reversal to $368 from the lows of $51, representing an increase of 620% (7.2x), which is a good arbitrage premium. This article and analysis gives a buy rating at the right entry price. It’s only recommended for investors who are aware of the high risk nature of Coinbase and are interested in the next generation of fintech and digital economy.
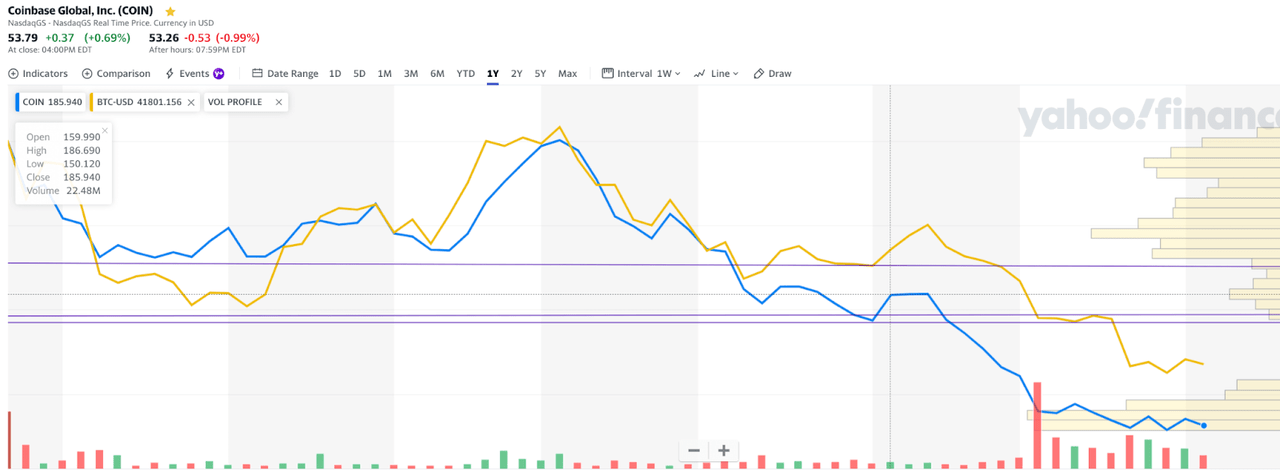
$COIN Price Change vs. Bitcoin, July 15th, 2022 (Yahoo Finance)
Competitiveness
Coinbase has the highest number of institutional clients and trading volume. While the current revenue generated from it might still be relatively small, as seen in the latest Falconx fundraising round (valuing the company at $8B), institutional adoption will be the next wave of exponential growth.
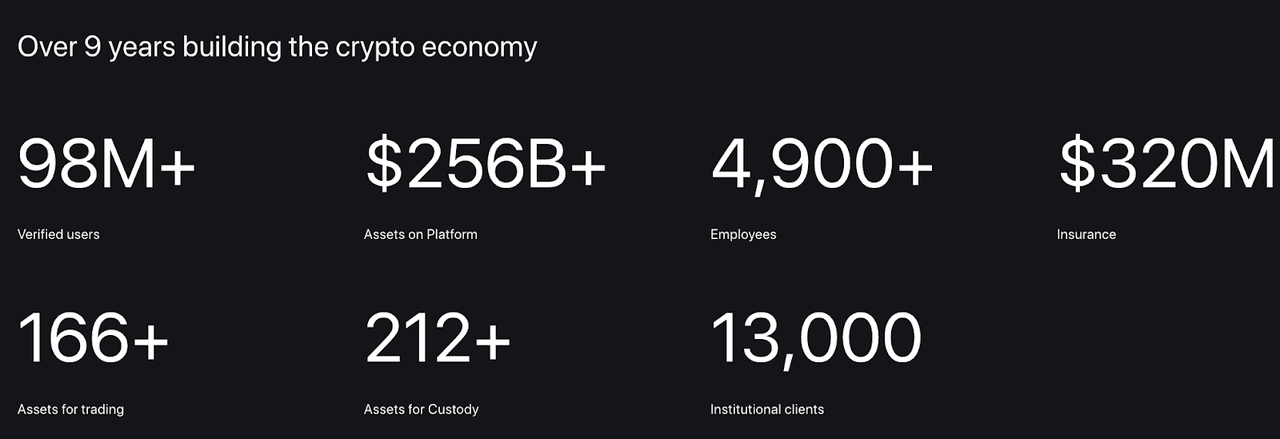
Coinbase metrics (Coinbase Institutional solutions)
It’s important to note that consistency, ease of use, security, and trust are four of the most important aspects and differentiators to win in the competitive crypto space as platforms like Coinbase serve as the safekeeper of investors’ digital assets similar to the legacy banks in traditional banking. The collapse of Mt Gox, Terra, Three Arrow Hedge fund, Celsius and more shows how important fiduciary duty is to crypto exchanges and platforms that Coinbase fulfills. They avoided the downfall by staying in compliance with SEC and canceling the launch of “Lend” products.
Premium Market & Fees Structure
Coinbase’s competitors capture higher trading volume because they do business in more geographical and less regulated locations and have a wider variety of trading products including derivatives. Despite this, Coinbase will continue to navigate the regulatory environment by slowly rolling out derivatives, even though these would be a more limited offering. As stated above, that’s better risk management and protection to customers. In the meantime, Coinbase captures a higher premium customer base with its highest fee structure so far.
|
Coinbase |
Kraken |
Binance |
FTX |
|
|
Tier 1 (least vol users) |
0.60% |
0.26% |
0.075% |
0.07% |
|
Coinbase vs others (multiples) |
1 |
2.31 |
8.00 |
8.57 |
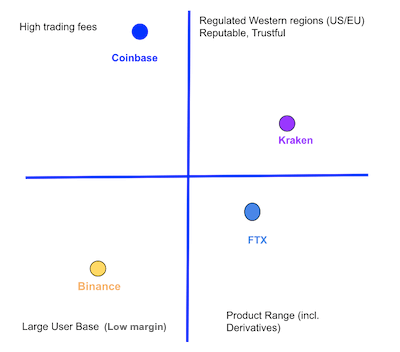
Coinbase comparison quadrants ( Author)
Technical analysis & entry price
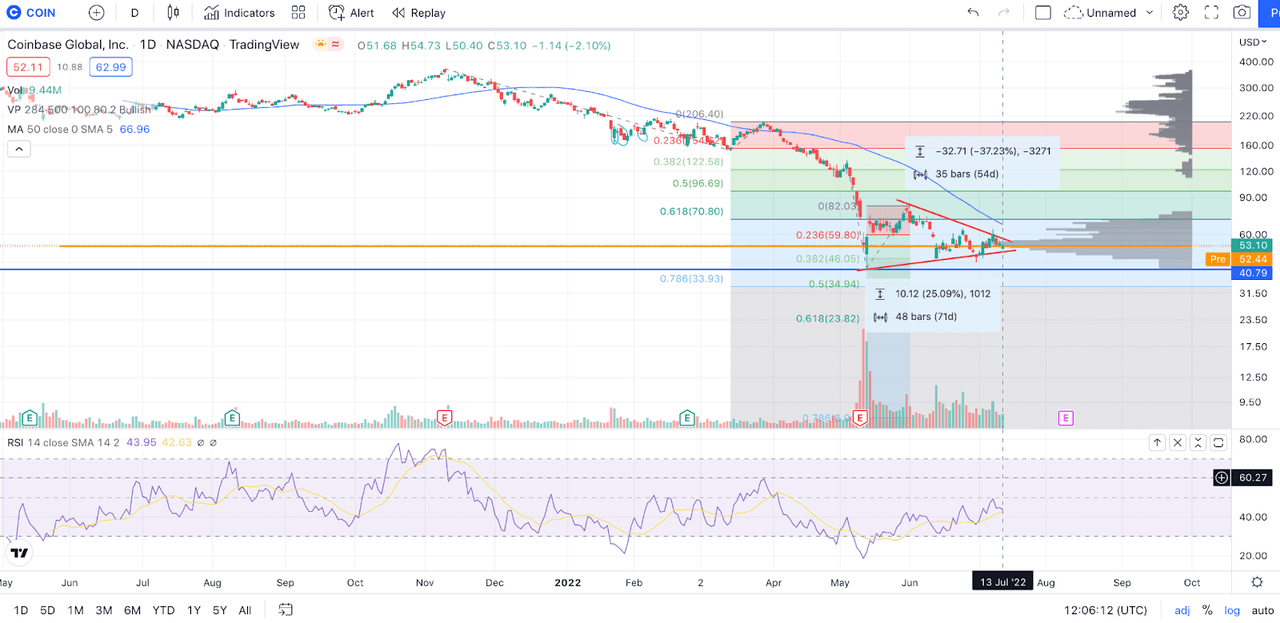
Coinbase Price levels and Volume Profile (Tradingview)
In terms of the technical analysis, the price hovers between $47 and 63. The volume profile measures and looks back to Coinbase’s IPO day of April 2021 and shows the majority of the volume around $52-53 after the price drop due to the May 9th Q1 earnings report. Overall, there is a relatively strong support at $46-47, but not a strong directional trendline. The breakout could tend toward the upside if there is positive news in the upcoming earnings call in August or to the downside for any negative reports and major pull-back in BTC price.
The first hurdle is to bounce above $70.8 and then the $82 levels, which would bring enough volume to generate some upward momentum. If it passes above the $96-97 levels, the uptrend will be retested again and provide more concrete confirmation. For investors preferring a more clear trendline, it is better to wait for two-three weekly green candles above $70.8-$82 and the RSI between 30-45. If the RSI is above 70, wait for the retest.
Key takeaways
-
Investing in crypto and related companies such as Coinbase is risky, and investors need to have a clear plan and time horizon to weather the challenging environment. Evaluating too narrowly on a quarter-by-quarter basis might not generate effective judgment for companies like Coinbase. Historically and statistically, holding a long-term view, especially a four-year timeline, provides a bigger picture and view on the long-term trajectory and potential of the companies.
-
While the overall regulatory boundary and effort on crypto is nebulous, and the adoption is still at the early cycle, there are more uncertainties. But like VC or angel investments, it should offer a high-risk adjusted reward. Treat crypto or Coinbase investments like an angel investment. It’s not wise to go all-in.
-
Diversification is important in investing. However, investing in crypto should be done with extreme precaution. Do not attempt random projects, alternative unproven cryptocurrencies or yield products without a complete understanding.
-
In the current macro environment, there is a high probability of another down leg for Coinbase’s stock price. Whenever uncertainty or bad news hits the market, stocks like Coinbase will first trend downward. Be prepared. Do not panic sell or FOMO buy based on emotions.
-
In an unlikely event that the market pressure continues to heighten, valuation compresses, and more market consolidation occurs, Coinbase would appeal to the legacy banks or financial services companies as a great potential M&A target.
