- Bitcoin price eyes up the inefficiency gap present up to $18,514 after facing rejection from the weekly open.
- Ethereum price will follow suit and revisit the $993 support level after an 11% correction.
- Ripple price has already collapsed by 15% but could drop another 5% to retest the $0.319 support floor.
Bitcoin price faced an intense sell-off as it approached the recent weekly open, indicating that investors are looking to book profits. This downswing has caused Ethereum, Ripple and other altcoins to take a dip as well.
Bitcoin price continues to tumble
Bitcoin price has dropped 5.5% since retesting the weekly open at $21,025 on June 28. The lack of buying pressure means bears have taken control. As a result, BTC has sliced through Monday’s low at $20,482 and is currently heading toward the previous Monday’s low at $19,612, which is also the liquidity objective from a market maker’s perspective.
Investors can now expect the downtrend to continue to $19,612. Bulls need to be patient, however, as this correction could slide even lower due to the presence of the Fair Value Gap (FVG) aka the price inefficiency, extending from $18,514 to $19,120, suggesting even lower prices are possible before the market stabilizes.
The two turning points for Bitcoin price would be $19,612 and $18,514.
BTC/USD 2-hour chart
On the other hand, if Bitcoin price produces a four-hour candlestick close below $18,040, it will indicate that sellers are in control. This development could see BTC make fresh lows around $15,550.
Ethereum price ready for more lows
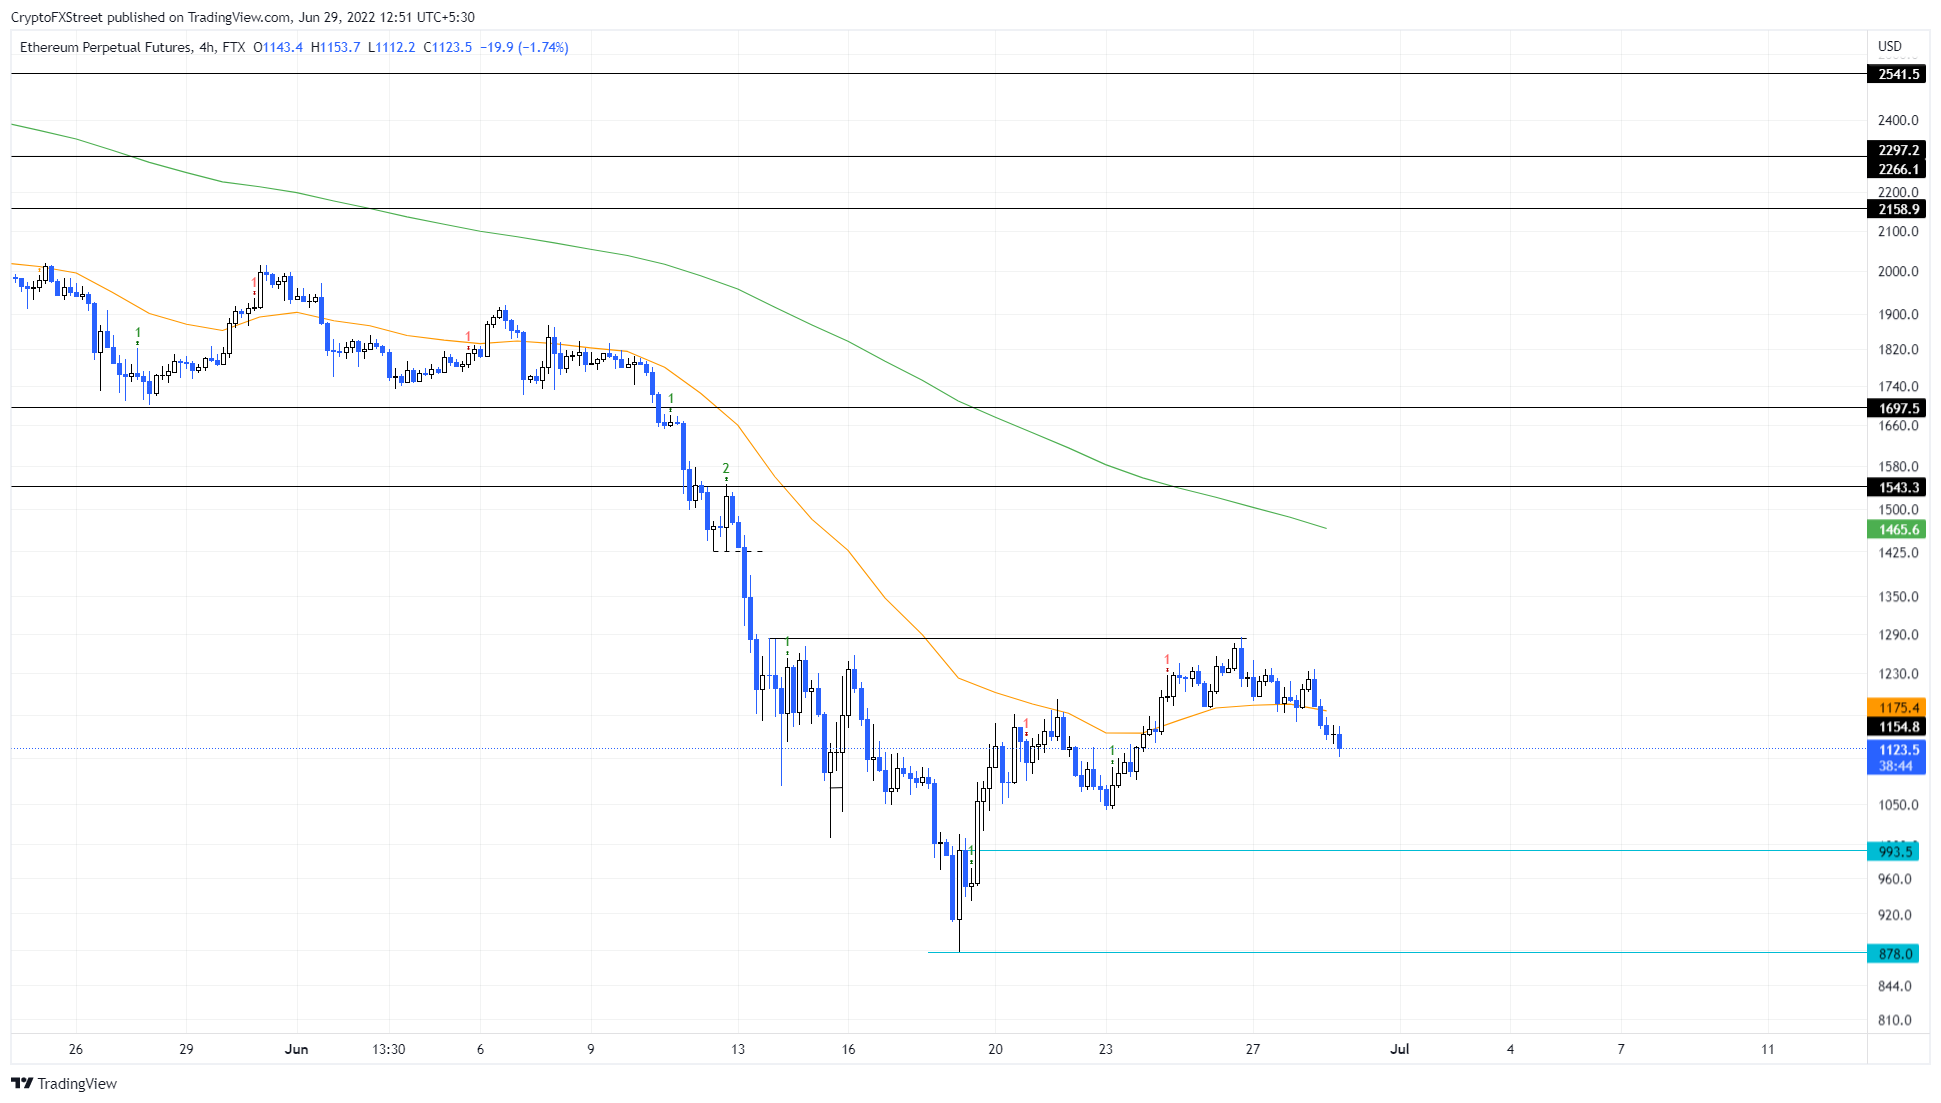
Ethereum price rallied 46% between June 19 and June 26 and set a swing high at $1,284. This impressive recovery rally, however, also created a double top, signaling a potential double top reversal formation.
Since then, ETH has dropped 13% and is likely to continue its downtrend as long as BTC continues to do the same. Going forward, investors can expect Ethereum price to reach the $993 support level.
In some cases, the smart contract token might sweep the June 19 swing low at $878, which could also signal a bottom formation. However, a breakdown or a daily candlestick close below this level will indicate that more lows are on the horizon.
This development could see ETH slide to the $745 support level.
ETH/USD 4-hour chart
While things are looking bearish, a quick spike in buying pressure or a sudden trend shift in Bitcoin price could see similar changes for Ethereum price. In this case, if ETH produces a four-hour candlestick close above $1,248, and successfully flips it into a support level, it will invalidate the bearish thesis.
This development could trigger ETH to climb to $1,465, which is the 34-day Exponential Moving Average (EMA).
Ripple price takes the first step
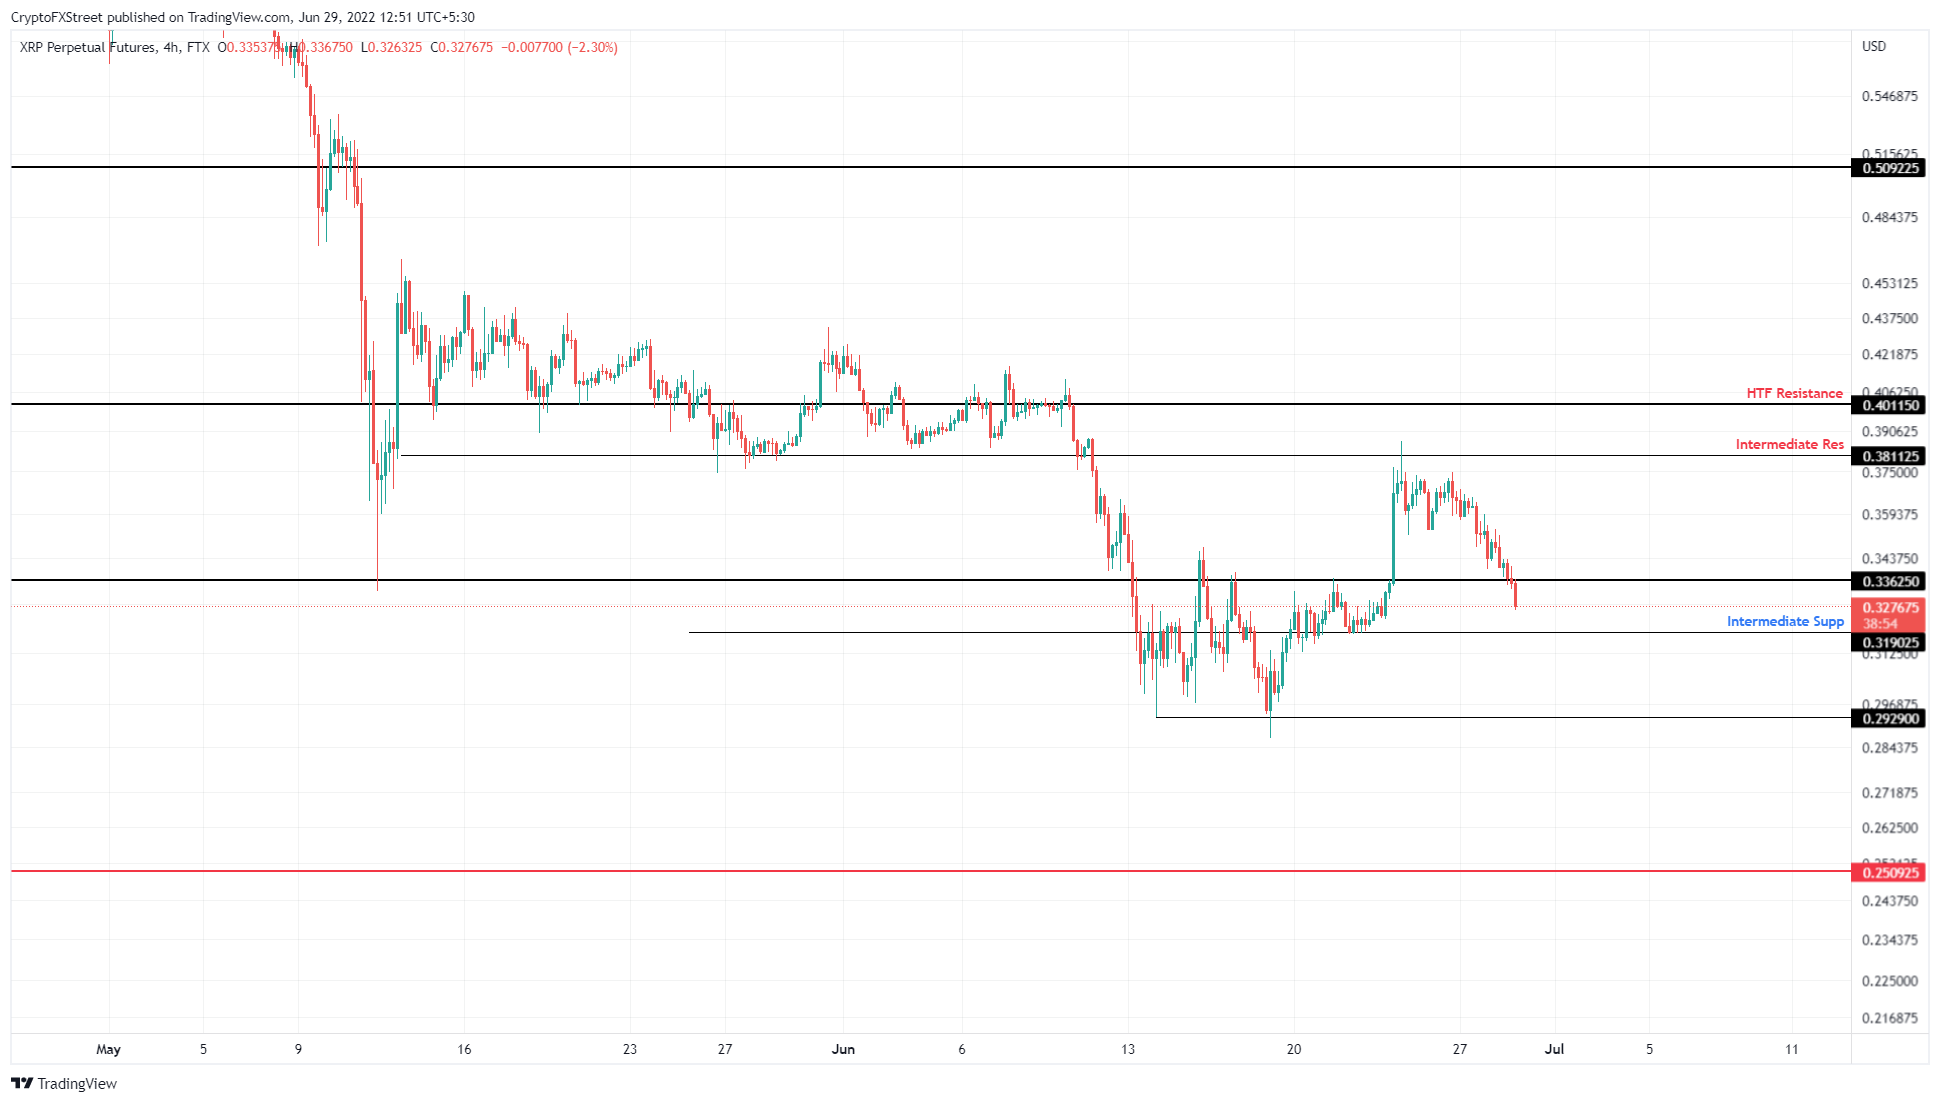
Ripple price seems to be frontrunning the sell-off as it has already dropped 15% from its June 24 swing high at $0.386. This downswing suggests that Ethereum and Ripple are highly suggestible and are likely to follow in Bitcoin’s footsteps.
Investors can expect Ripple price to continue this trend until it reaches the $0.319 support level. A breakdown of this barrier might see XRP price retest $0.292. This is the last line of defense for the remittance token, so a flip of this foothold into a hurdle could see Ripple crash 15% to $0.250.
XRP/USD 4-hour chart
Regardless of the bearish outlook, if Ripple price produces a four-hour candlestick close above $0.401, it will create a higher high and invalidate the pessimistic outlook. This development could see XRP price extend its rally to $0.509.


