
- Bitcoin price shows strength despite the recent downswing, hinting at a move up north to $52,000.
- Ethereum price coils up before a move to $4,000.
- Ripple price is likely to retrace lower before catalyzing an exponential upswing to $1.
Bitcoin price has been heading south lately, but this has allowed a select few altcoins to go wild. Ethereum and Ripple do not seem to be on this list and are likely going to take more time before they trigger a bull rally.
Bitcoin price readies for its next leg-up
Bitcoin price is retesting the $42,076 support level after crashing nearly 12% since its March 28 swing high at $48,238. Interestingly, the said foothold also coincides with the $40,490 to $42,316 demand zone and also harbors the 50-day and 100-day Simple Moving Averages (SMAs).
Therefore, a retest of this launching pad is why investors can expect a high probability upswing that propels Bitcoin price to $44,580. If buyers push through it and flip it into a support floor, it will open the path for bulls to retest the 200-day SMA at $48,248.
In a highly bullish case, Bitcoin price will look to retest the $50,000 psychological level and the $52,000 ceiling. This run-up, in total, would constitute a 21% upswing and is likely where the upside for the big crypto is capped at.
BTC/USD 1-day chart
While things are looking up for Bitcoin price, a sudden spike in selling pressure that pushes it below the $40,490 level will invalidate the bullish thesis and open the path for a retest of $34,752 support barrier.
Ethereum price coils up
Ethereum price has been hovering above the high volume node at $3,136 for four days. If the big crypto shoots higher, ETH is positioned perfectly for skyrocketing to $3,703 aka the low volume node.
In a highly bullish case, the Ethereum price might extend to the next high volume node at $4,040, bringing the total run-up to 27%.
In the event of a downswing, ETH has a cluster of support, extending from $2,820 to $2,966, which also harbors the 50-day and 100-day SMAs.
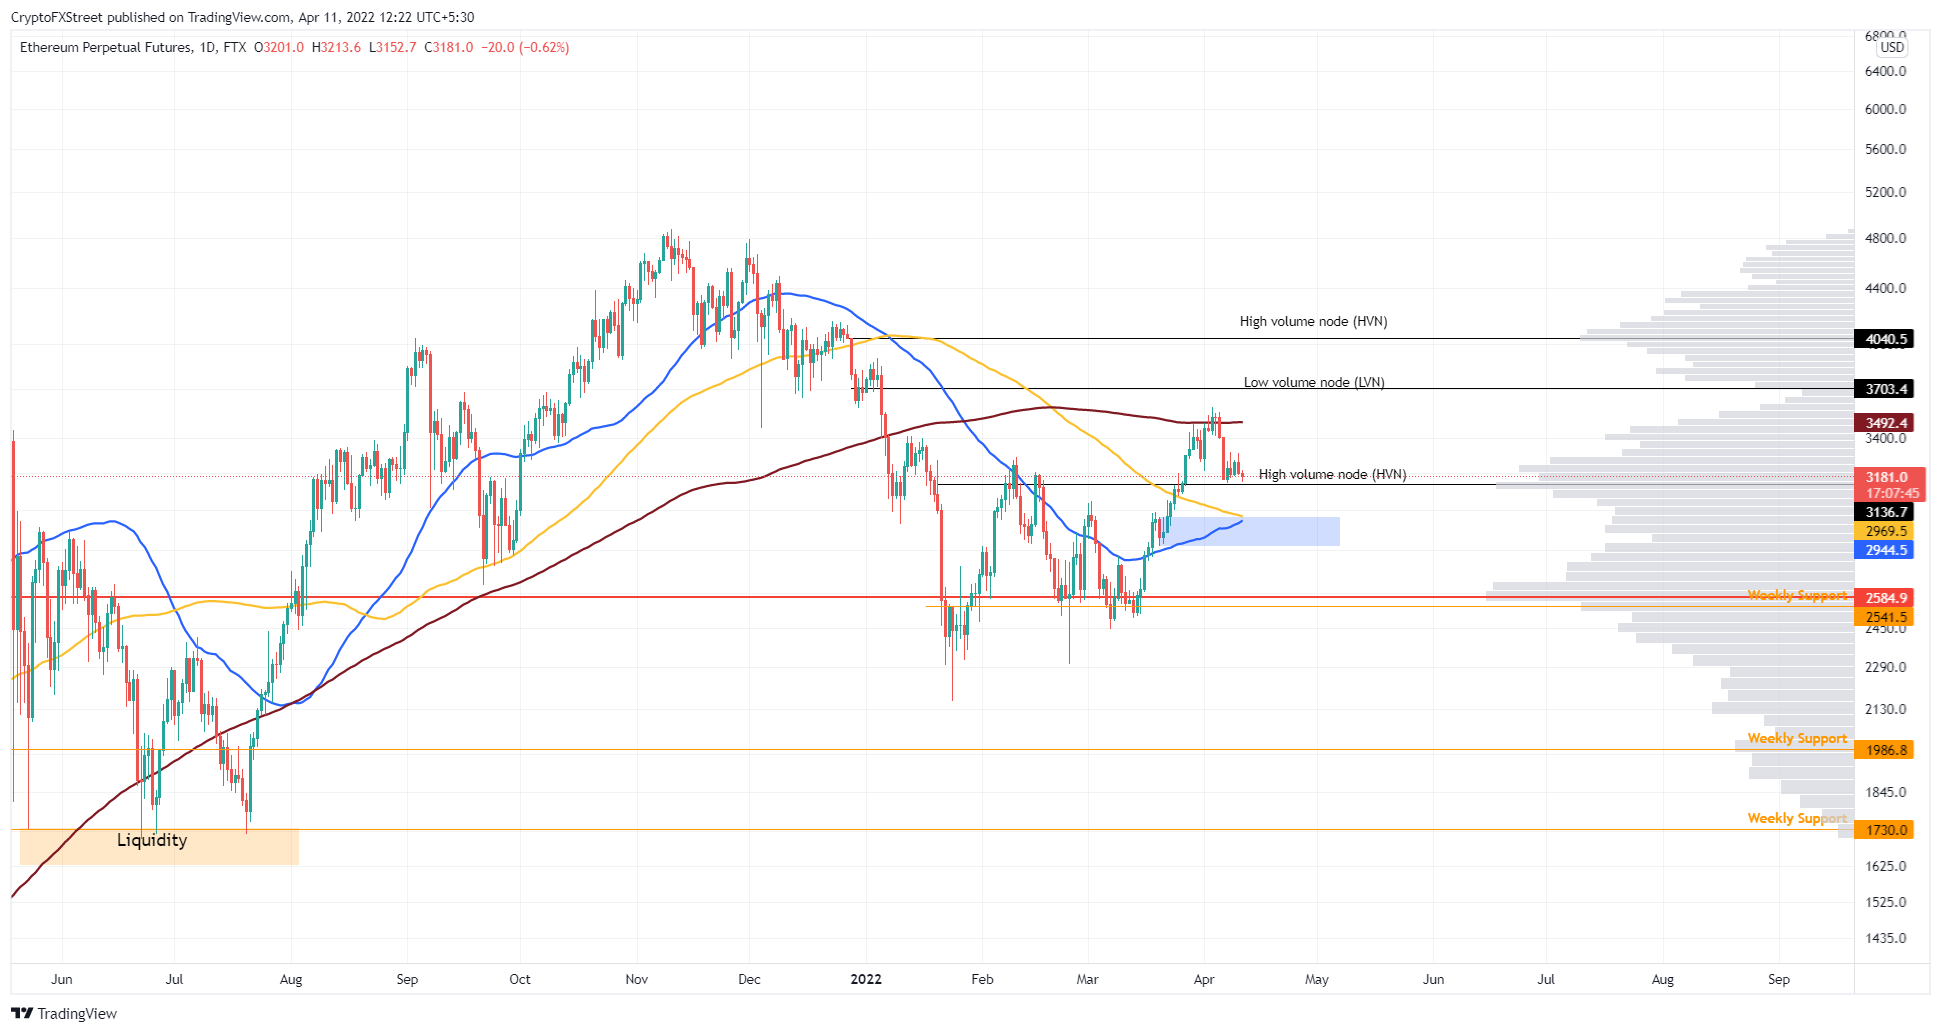
ETH/USD 1-day chart
A breakdown of the said support confluence by producing a daily candlestick close below $2,820 will create a lower low. Moreover, it would favor the bears and invalidate the bullish thesis. In such a case, ETH could retest the next high-volume node to the downside at $2,584.
Ripple price struggles
Ripple price stayed on its bullish path for nearly a month but the April 6 downswing pushed it below the 2022 volume profile’s point of control at $0.771. This level is where the most volume for 2022 is traded.
Therefore, a flip of this level into a resistance barrier will indicate that the bulls are weak and that the bears are in control. Due to this bearishness, investors can expect Ripple to slide lower and retest the $0.657 support level.
A bounce off this barrier is likely to trigger an upswing for XRP price that kick-starts its uptrend. The resulting bull rally should conquer the $0.771 point of control to have any chances of revisiting the $1 psychological level.
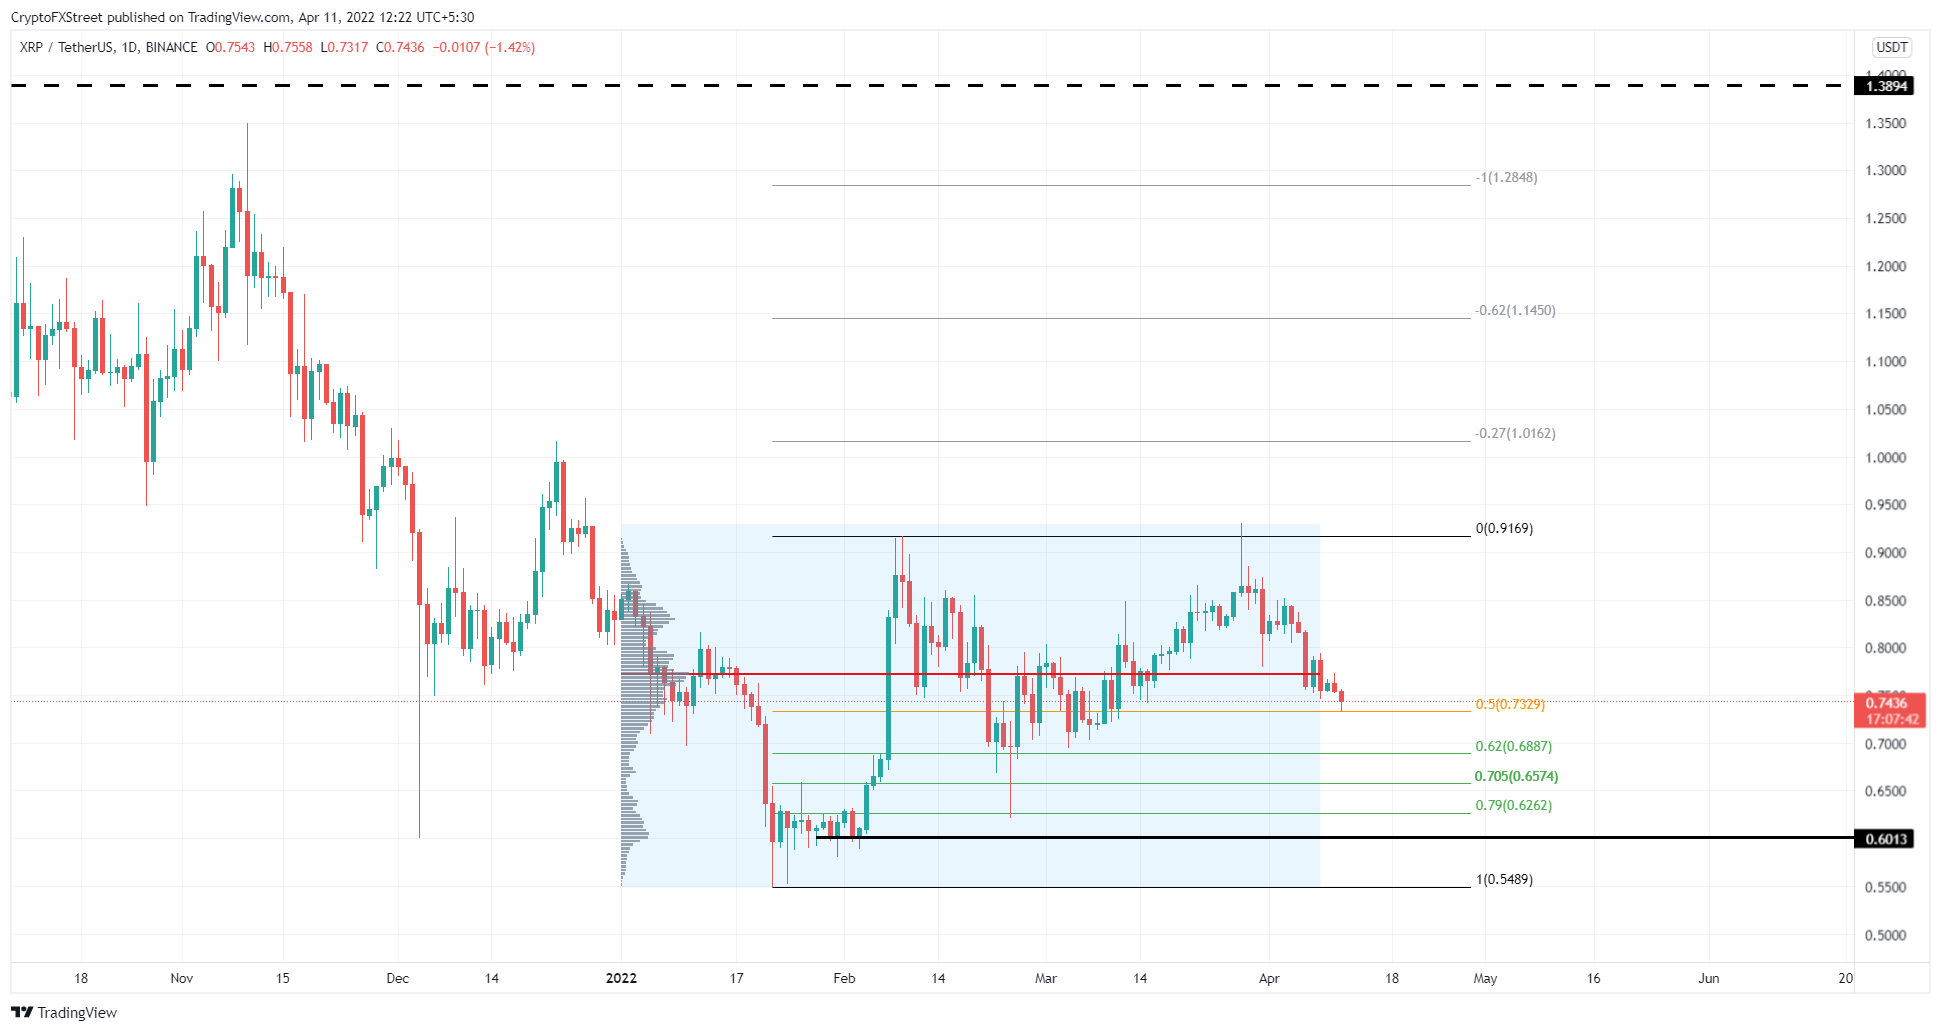
XRP/USD 1-day chart
On the other hand, if Ripple price breaks below the $0.601 support level, it will create a lower low and invalidate the bullish thesis. In this situation, XRP could crash to $0.548.