- Bitcoin price tightens around the yearly open at $46,198, before establishing a directional bias.
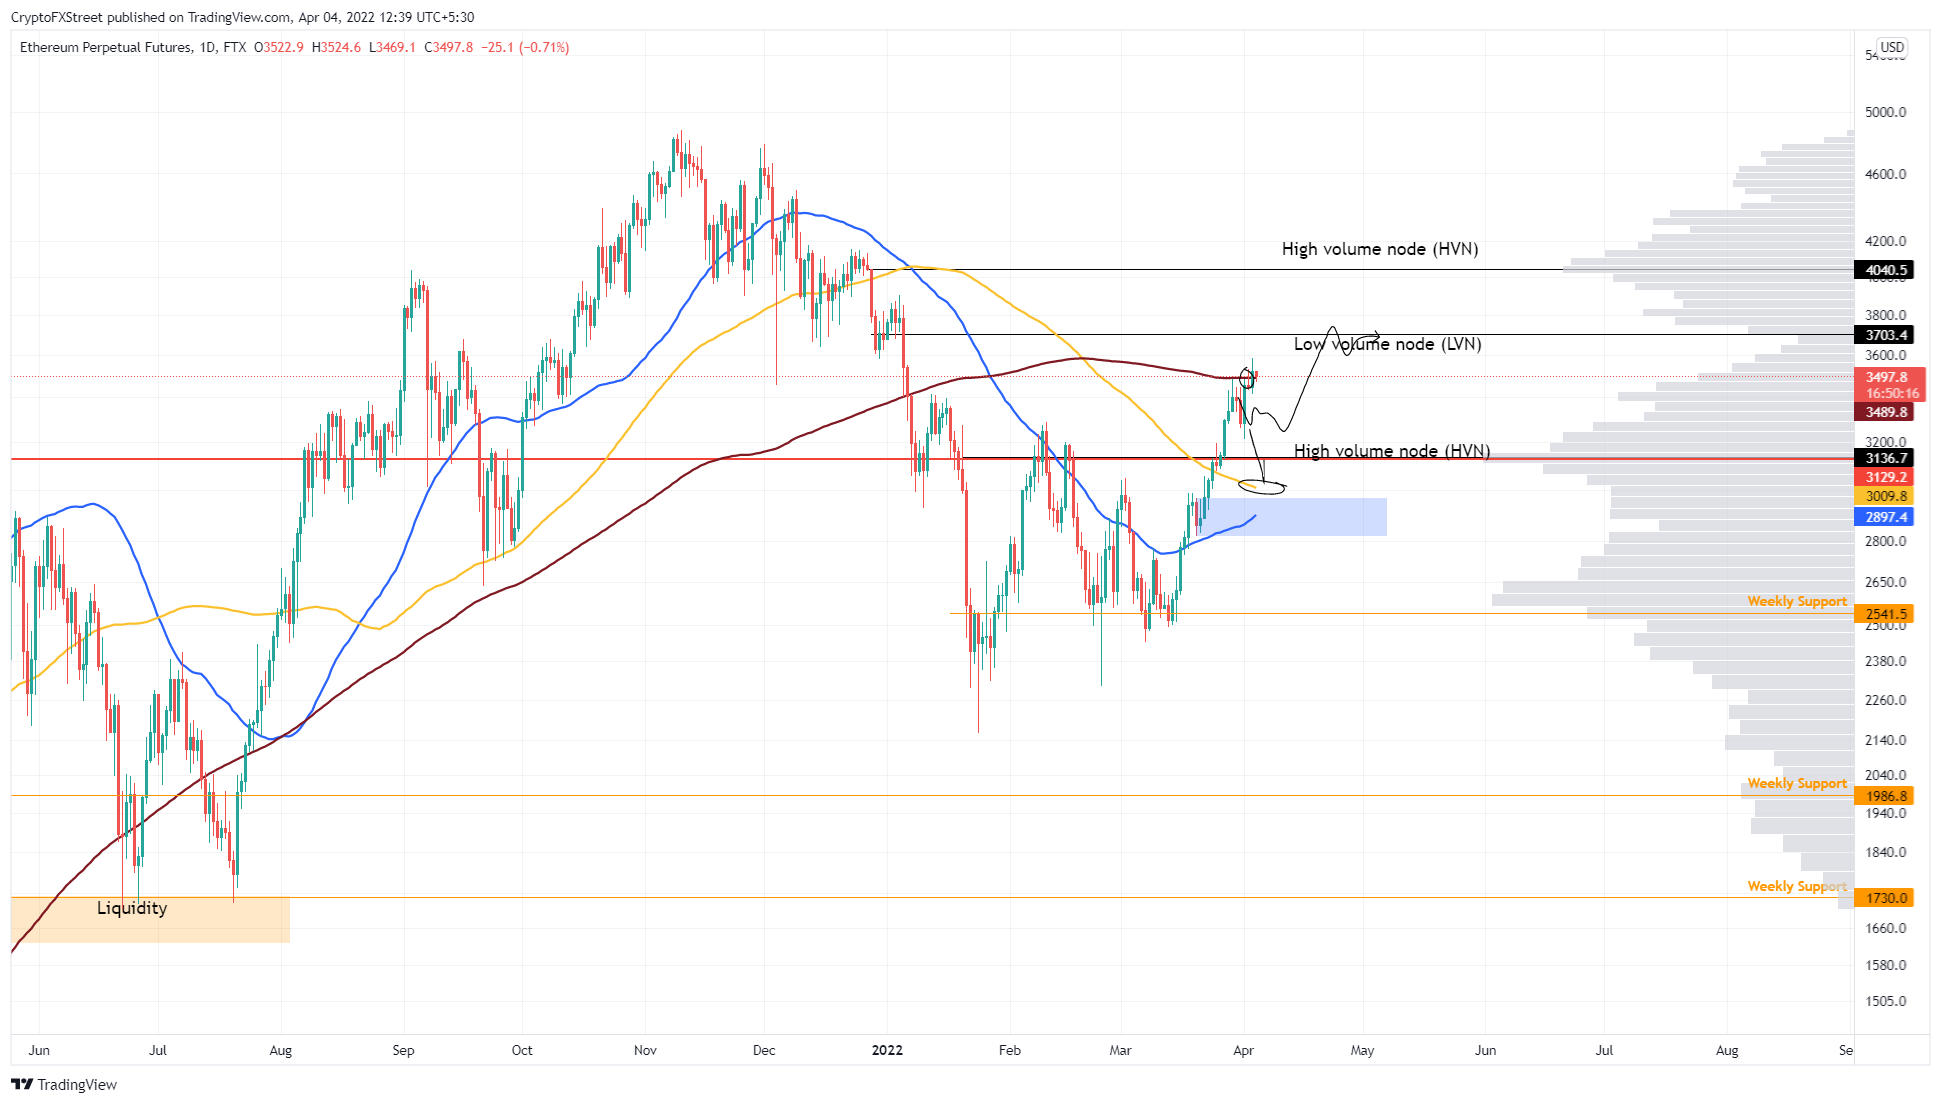
- Ethereum price grapples with the 200-day SMA at $3,489 trying to move higher.
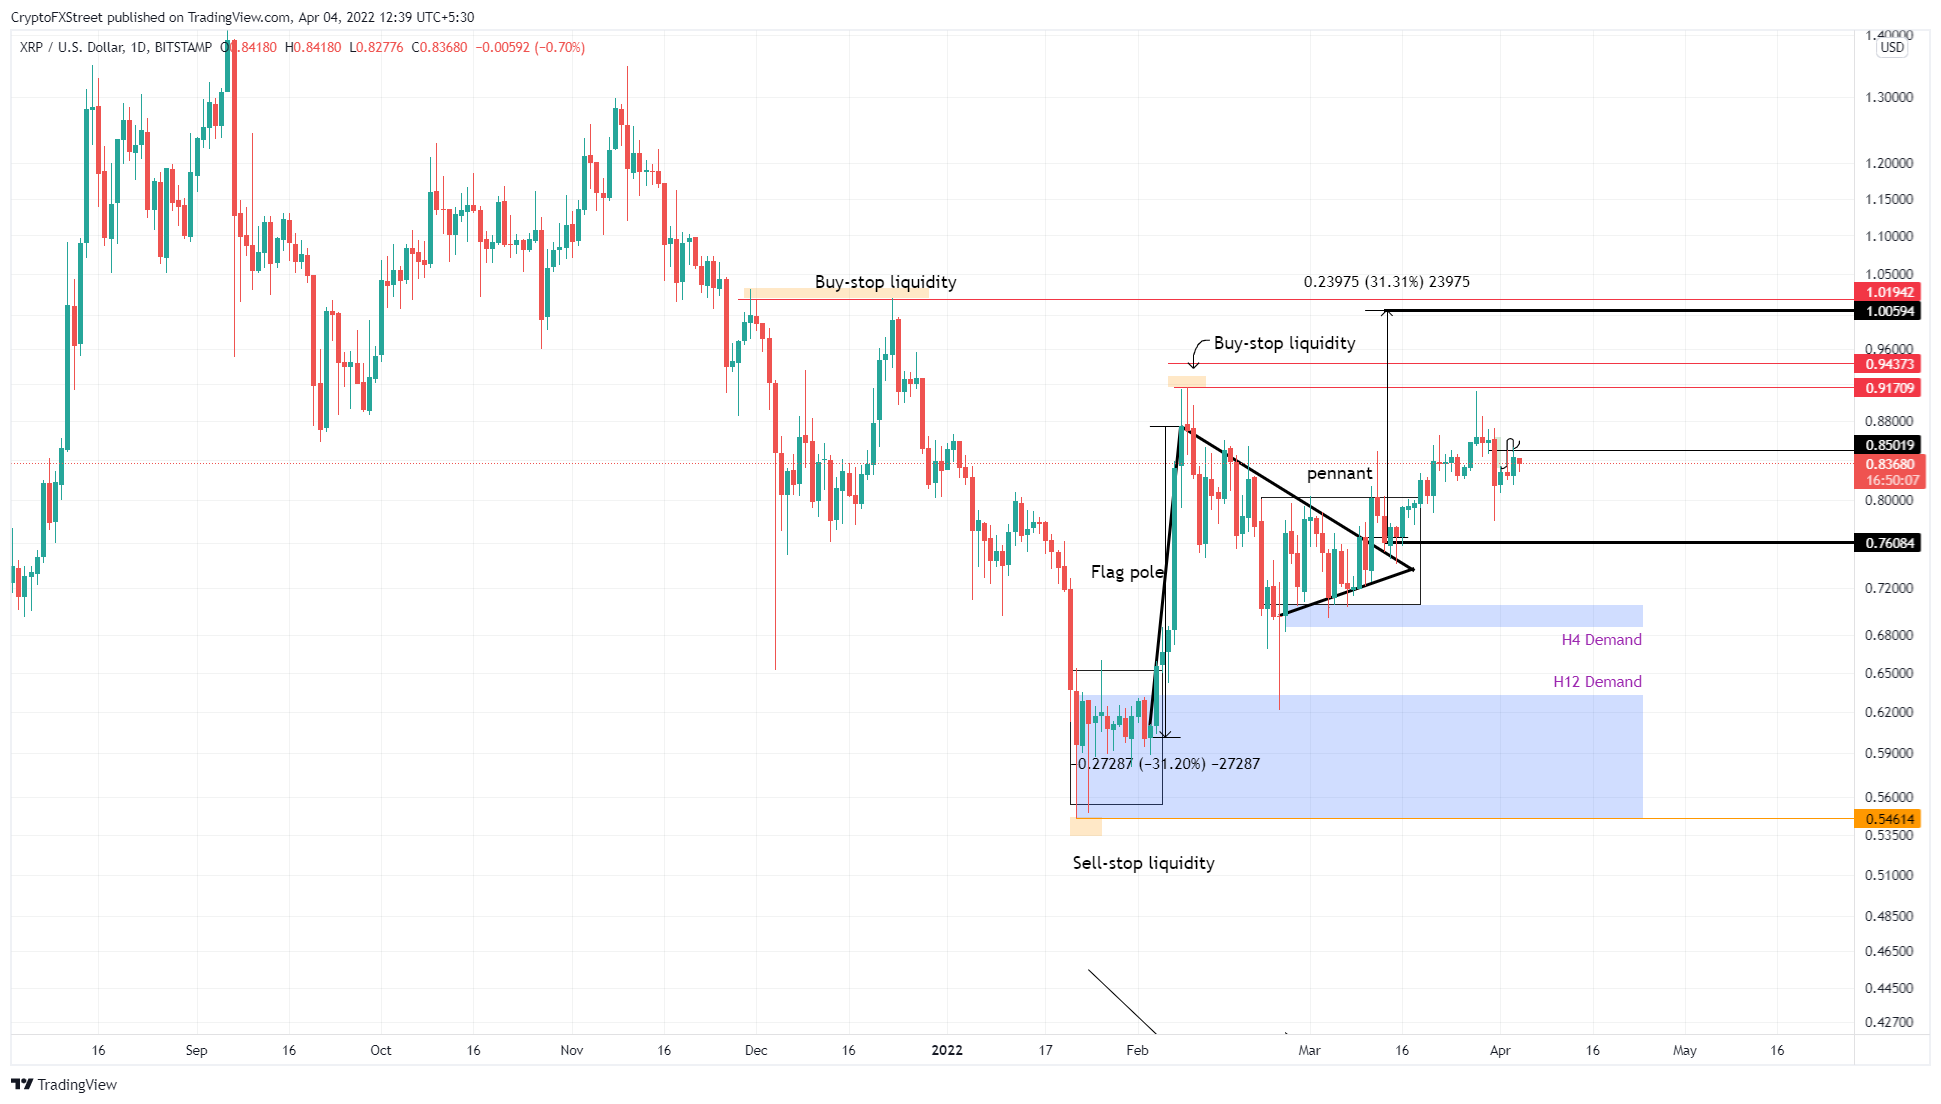
- Ripple price also struggles with uptrend as it hovers around the $0.85 barrier.
Bitcoin price is bracketing around the yearly open and shows no signs of breaking out. Moreover, a directional bias seems to be absent. Ethereum and Ripple are both facing crucial hurdles, the clearing of which will allow them to move higher.
Bitcoin price is disinterested in moving
Bitcoin price shows a tight consolidative range around the yearly open at $46,198 for the fourth day in a row. This sideways movement will allow more players to speculate on the breakout move and hence increase volume.
Investors can expect BTC to make a run at the $50,000 psychological level as it breaks from the ongoing consolidation. In a highly bullish case, Bitcoin price could even tag the $53,000 hurdle in an attempt to set a higher high.
BTC/USD 1-day chart
While things are looking up for Bitcoin price, a daily candlestick close below $44,580 will invalidate the bullish thesis. This move would open the possibility of flipping the support into a resistance barrier.
Ethereum price struggles
Ethereum price aimed for a retest of the low volume node at $3,703 after it breached the 100-day and 50-day Simple Moving Averages (SMAs). However, the 200-day SMA at $3,489 seems to be blocking the uptrend.
A successful flip of this barrier will open the stage for Ethereum price to retest $3,703. In some cases, ETH could also tag the $4,000 psychological level, bringing the total ascent to 16%.
ETH/USD 1-day chart
In the event that the big crypto decides to pull a ‘one-hundred-and-eighty’, the Ethereum price will follow suit. Such a development could see Ethereum price retrace to the high volume node at $3,136. A breakdown of this barrier will create a lower low and invalidate the bullish thesis.
Ripple price slows its momentum
Ripple price has been in a steady uptrend since its breakout from the bull pennant on March 11. XRP price tagged the $0.85 target, but when it made a run-up to the next level at $0.91, it failed to tag that.
The retracement following its rejection at $0.91 led to a fall back to the $0.85 level. Currently, Ripple price is hovering around this barrier and shows no signs of moving higher due to the ongoing consolidation with the big crypto.
XRP/USD 1-day chart
On the other hand, if the Ripple price fails to move above $0.85, there is a good chance it will retrace to $0.76. Here, buyers have a chance to make a comeback but failing to do so might lead to a breakdown and invalidation of the bullish thesis.


