
- Bitcoin price is likely to revisit $44,000 before making a move toward $50,000.
- Ethereum price slides below the 200-day SMA at $3,489 to reevaluate directional bias.
- Ripple price needs to collect liquidity below $0.77 before triggering a run-up to $1.
Bitcoin price has sliced through the yearly, weekly, and monthly open as it undergoes a steep sell-off on March 5. This downswing is likely a precursor before BTC rallies to a significant level. Ethereum and Ripple have both declined and are reevaluating their strategy before moving higher.
Bitcoin price sets a launchpad
Bitcoin price broke out of its tight consolidation and shattered through the yearly open at $46,198, it has currently set up an equal low at $44,221. The market makers are likely to push BTC below this level before triggering a bullish move.
After the liquidity grab, investors can expect BTC to make a run at the $50,000 psychological level. In a highly bullish case, Bitcoin price could even tag the $53,000 hurdle in an attempt to set a higher high.
BTC/USD 1-day chart
While things are looking up for Bitcoin price, a daily candlestick close below $44,580 will invalidate the bullish thesis. Such a development will open the possibility of retesting the $42,076 support level.
Ethereum price struggles
Ethereum price aimed for a retest of the low volume node at $3,703 after it broke above the 100-day and 50-day Simple Moving Averages (SMAs). However, the 200-day SMA at $3,489 stopped the uptrend despite a brief move above it.
Due to the lack of momentum, the move above the 200-day SMA was unsuccessful, and the rejection led to a retracement. This move is likely to extend and retest the high volume node to the downside at $3,136, coinciding with the volume point of control, the most traded point and a key support and resistance level on the chart
A bounce off this barrier will be key in triggering a move to retest the $4,000 psychological level.
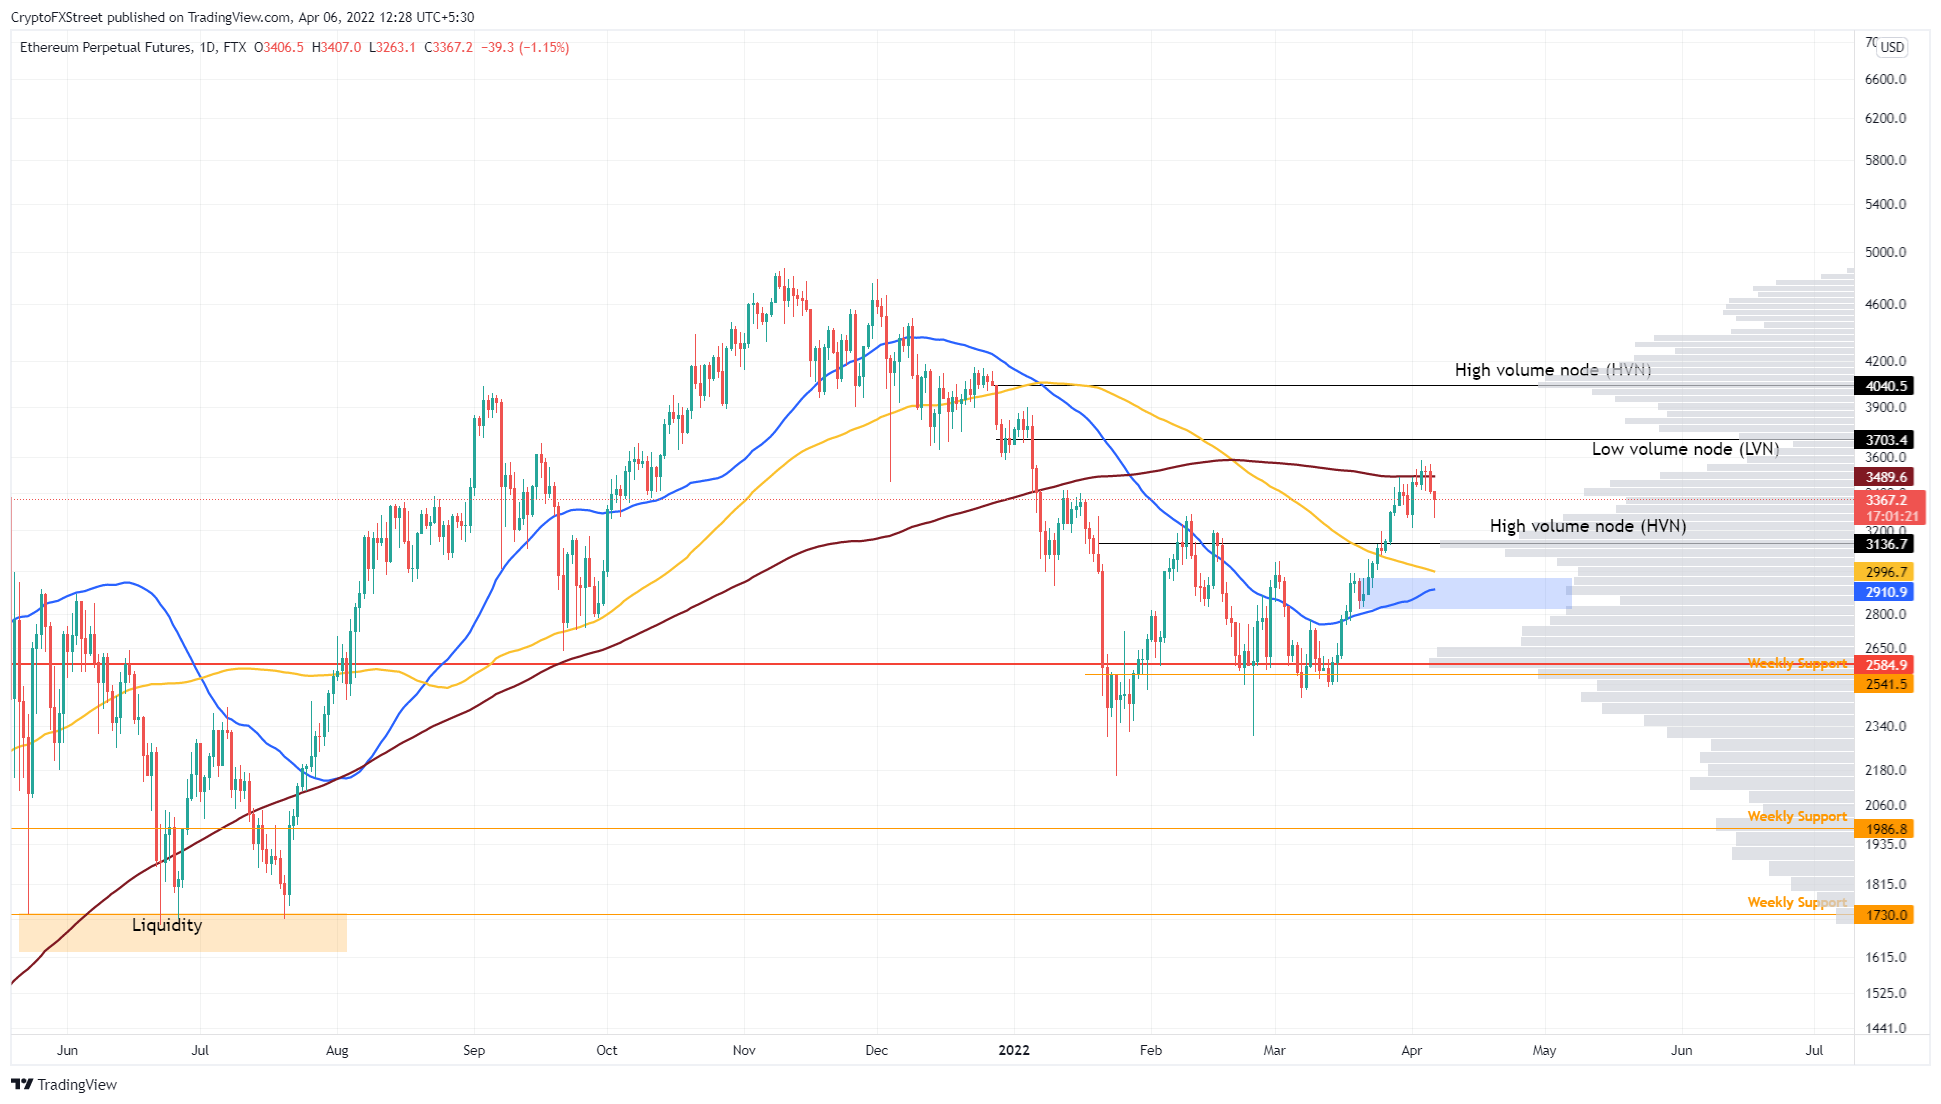
ETH/USD 1-day chart
On the other hand, if the big crypto decides to breach the $44,580 support level, the Ethereum price will follow suit. Such a development could see Ethereum price retrace to the $2,820 to $2,966 demand zone, a breakdown of which will create a lower low and invalidate the bullish thesis.
Ripple price slows its momentum
Ripple price broke the steady uptrend that it has been in since its breakout from the bull pennant on March 11. The pullback, which was a result of BTC’s flash crash, pushed the XRP price to create an equal low at $0.77.
Investors can expect market makers to temporarily push the remittance token below the said level to collect liquidity. Completing this liquidity run will be the signal that a new uptrend has begun. The resulting rally is likely to retest the $0.91 resistance barrier.
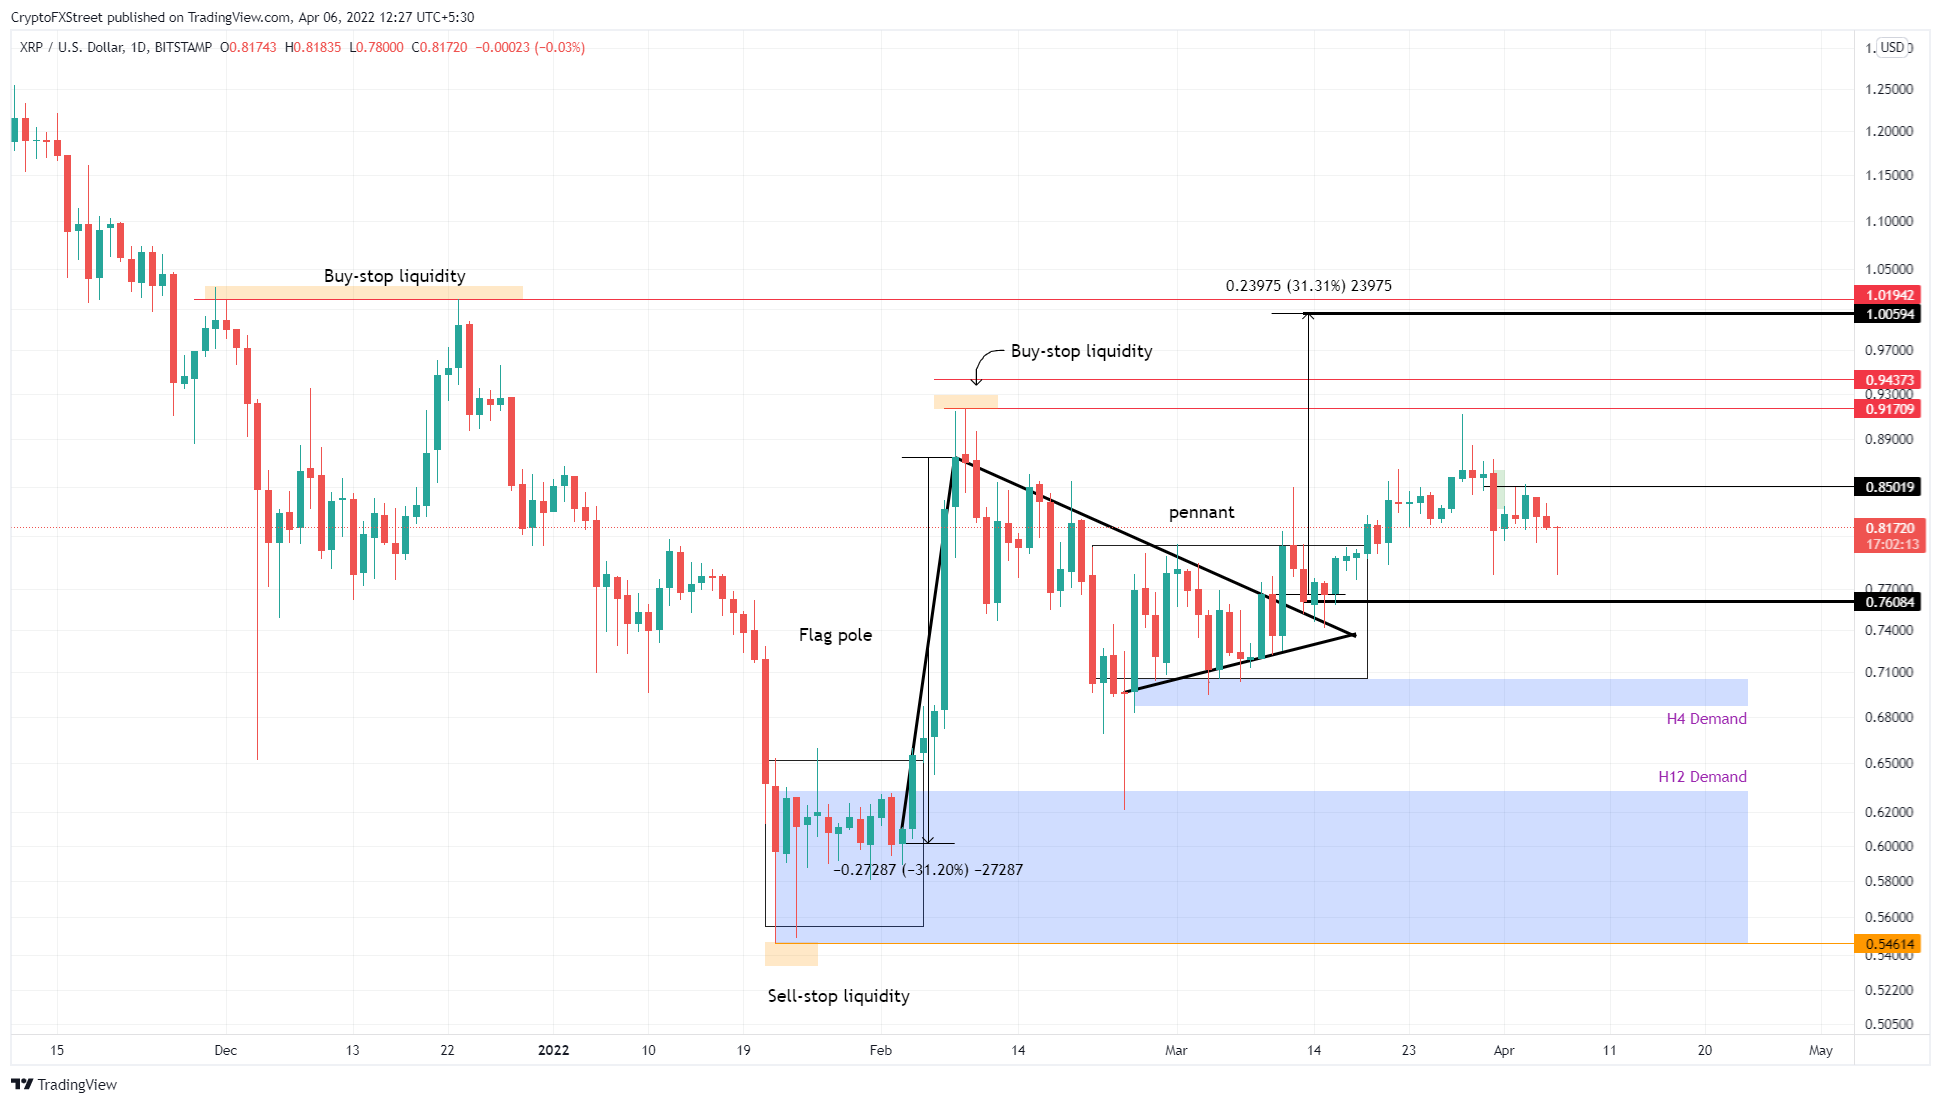
XRP/USD 1-day chart
If the Ripple price fails to hold above the $0.76 foothold, it will create a lower low and invalidate the bullish thesis. Such a move could trigger a further descent to $0.70, where buyers can attempt to restart the upswing.