
March 1 – Welcome to the home for real-time coverage of markets brought to you by Reuters reporters. You can share your thoughts with us at markets.research@thomsonreuters.com
RUSSIA-UKRAINE ECONOMIC FALLOUT: A RIPPLE IN THE U.S., A WAVE IN EUROPE (1212 EST/1712 GMT)
The economic effects from Russia’s invasion of Ukraine on the U.S. economy are likely to be minimal, but elsewhere they are likely to increase in severity the closer the country’s geographic proximity and economic involvement with Ukraine and Russia, according to two research notes.
Register now for FREE unlimited access to Reuters.com
Goldman Sachs (GS) believes the conflict, while sending the Federal Reserve’s geopolitical risk index to “a very high level,” will have a nominal 0.1 percentage point negative impact on U.S. GDP.
Regarding Fed policy, the GS note says that “historically, Fed officials have sometimes preferred to delay major policy decisions until uncertainty surrounding geopolitical risks diminished,” but lead analyst Jan Hatzius adds that “the current situation is different,” because “inflation risk has created a stronger and more urgent reason for the Fed to tighten today than existed in past episodes.
But as for the rest of the world, the damage from Russia’s actions is likely to be more deeply felt.
Oxford Economics (OE) sees the Russian invasion of Ukraine shaving about 0.2% from global GDP, although the impact will vary according to region, with Russia’s economy suffering the worst of it, dropping by 4% to 6%, according to Adam Slater, OE’s lead economist.
Slater adds that “evidence from previous conflicts also points to a very steep drop in Ukraine’s GDP,” and elsewhere in Europe “the negative effects will be greater than the global average due to stronger trade links with Russia and Ukraine, and most importantly the large gas price shock triggered by the conflict.”
But in the U.S., risks are “barely changing,” Slater writes.
(Stephen Culp)
*****
THE DAY EURO ZONE BANKS MET THE (RUSSIAN) BEAR (1150 EST/1650 GMT)
It’s been another rough session for European stocks which have just closed down about 2.4% as the consequences of Russia’s invasion of Ukraine continue to shake global markets.
While the Travel & Leisure sector was the most hit with airlines dragging the sector down over 7.5%, this Tuesday may be remembered as a turning point for euro zone banks.
Shares in lenders from the euro area lost 6.8% today which brings their fall from their February 10 highs to a whopping 25%.
The fall in European banks came as traders dramatically scaled down their expectations of monetary tightening from the European Central Bank and the yield of Germany’s Bund went back to negative territory with a dramatic drop of 25 basis points.
Many banks like Austria’s Raiffeisen or France’s SocGen are suffering from their exposure to the Russian market but the whole sector is seen as a cyclical stocks, which as such, is likely to suffer from the economic fallout of the conflict.
(Julien Ponthus)
*****
PMI, CONSTRUCTION SPENDING: DEJA VU ALL OVER AGAIN (1115 EST/1615 GMT)
Twofer Tuesday offered two major data releases, both of which sang a familiar medley of strong demand under a cloud of supply challenges, and robust construction spending propped up by homebuilding.
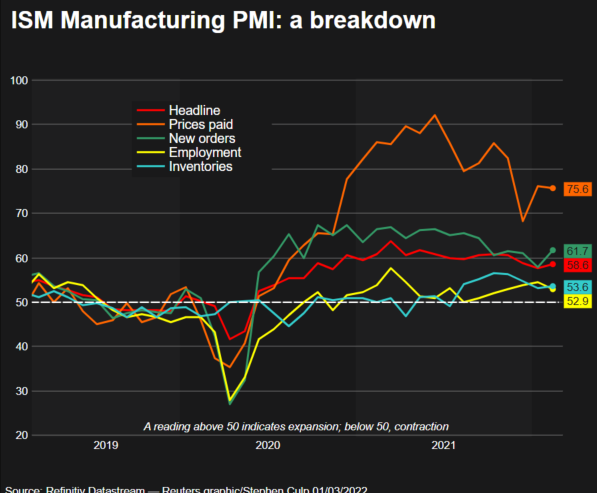
Activity in U.S. factories gathered some steam in February, accelerating at a slightly faster pace than analysts expected.
The Institute for Supply Management’s (ISM) purchasing managers’ index (PMI) (USPMI=ECI) posted a 1-point gain to 58.6, a tad warmer than the 58 consensus. read more
A PMI number over 50 indicates increased activity versus the previous month
The crucial new orders component did much of the heavy lifting, while the closely watched prices paid segment barely cooled, shaving a mere half-point to a still-white-hot 75.6 – suggesting inflated input prices aren’t going to be receding any time soon.
But the employment index lost some oomph, slowing down to 52.9, a 1.6 point deceleration.
“The U.S. manufacturing sector remains in a demand-driven, supply chain-constrained environment,” writes Timothy Fiore, chair of ISM’s Manufacturing Business Survey Committee. “The COVID-19 omicron variant remained an impact in February; however, there were signs of relief, with recovery expected in March.”
Among the survey’s respondents, phrases like “supply chain is still a mess,” and “continuing difficulties in procurement” were mitigated by sunnier words like “strong sales growth” and “markets (are) coming back.”
Or, as Ian Shepherdson, chief economist at Pantheon Macroeconomics, puts it, “overall, peak supply-chain pressure clearly was some time ago, and the problem is now chronic rather than acute.”
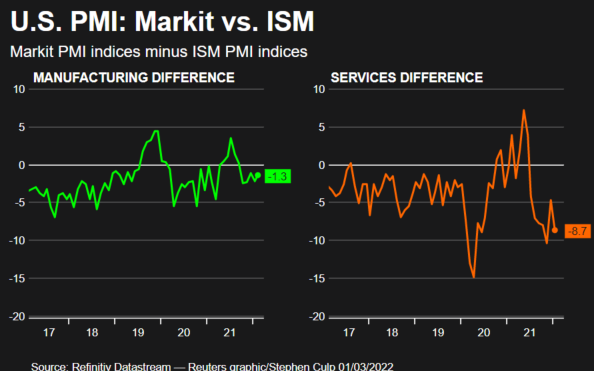
Global financial information firm IHS Markit also put its two cents in regarding February PMI (USMPMF=ECI), delivering a reading of 57.3, a slightly less robust acceleration than previously reported in its initial, ‘flash’ take.
ISM and Markit PMIs differ in the weight they apply to the indexes’ various subcomponents, such as new orders, employment, et al.
The graphic below subtracts ISM from Markit, showing the extent to which the two indexes agree (or not):
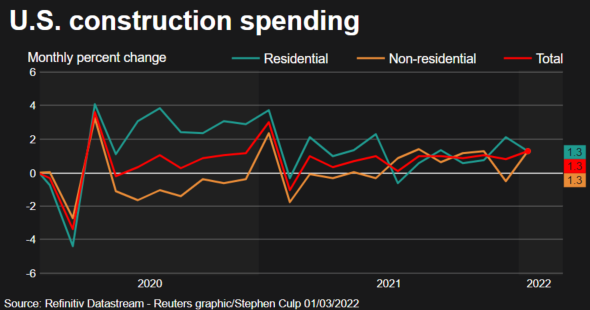
Separately, a report from the Commerce Department showed expenditures on U.S. construction projects (USTCNS=ECI) jumped 1.3% in January, bulldozing past the tepid 0.2% gain seen by economists. read more
The data was particularly sunny on the back of the December number, upwardly revised to 0.8%.
Private sector spending did the heavy lifting, with residential and non-residential expenditures both rising 1.3%, offsetting declines in commercial and lodging projects.
Outlays on publicly funded building were unchanged.
Homebuilding has dominated construction expenditures since the onset of the pandemic, when a mad dash for the suburbs sent inventories to record lows.
But with recent home sales and mortgage demand data suggests the party could be drawing to a close, as sky rocketing home prices and rising interest rates are pushing the dream of home ownership beyond the real of potential buyers, particularly at the lower end of the market.
Noting that the data accounts for about 5% of GDP, Rubeela Farooqi, chief U.S. economist at High Frequency Economics writes “momentum in residential and nonresidential was positive to start” in 2022, but “public construction spending started Q1 on a weak note.”
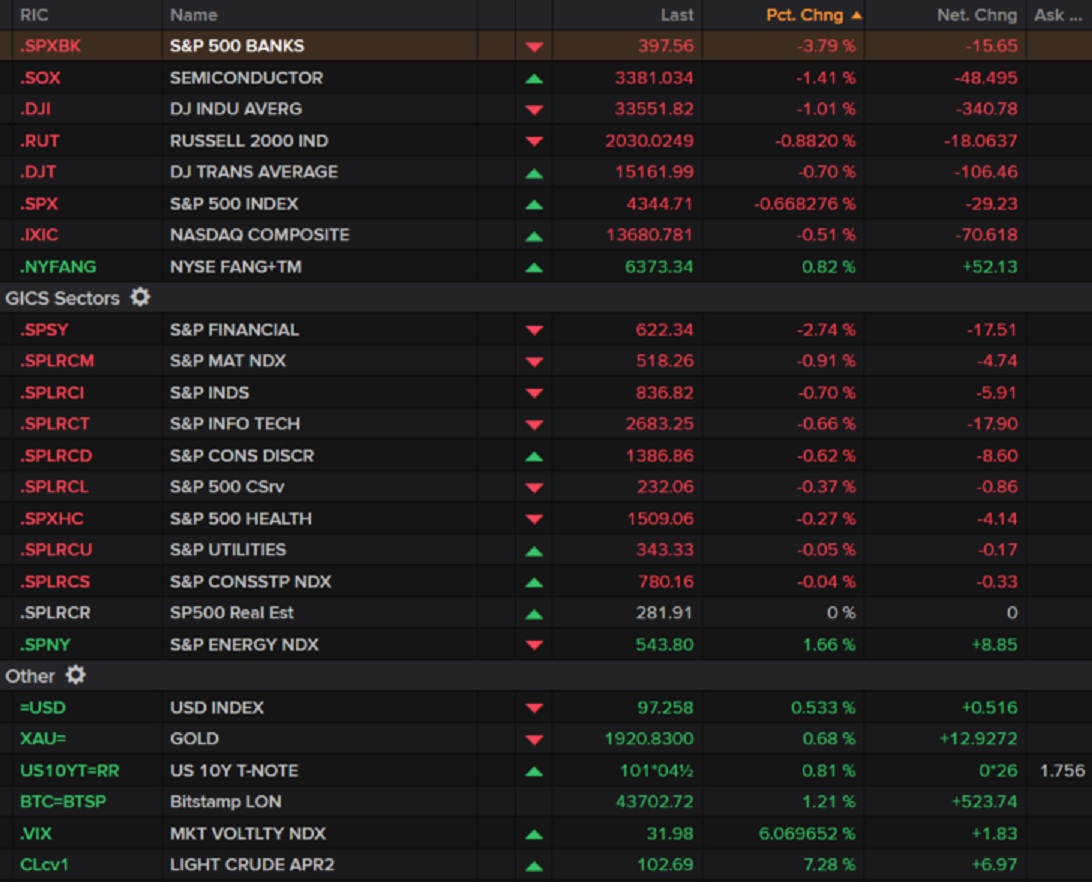
Wall Street dipped its toe in the red sea at opening before deciding to take the plunge.
All three major U.S. stock indexes are now resolutely negative, with financials (.SPSY) leading the fall.
(Stephen Culp)
*****
RED WAVE FOR U.S. STOCKS IN EARLY TRADE (1014 EST/1514 GMT)
Wall Street’s main indexes are lower in early Tuesday trade with bank stocks declining further as the Russia-Ukraine crisis deepened, while a surge in oil prices boosted shares of energy companies.
Indeed, a majority of major S&P 500 (.SPX) are red with financials (.SPSY) the weakest group. The U.S. 10-Year Treasury yield has now tumbled from a high of nearly 2.07% on February 16 to a low of 1.7140% at one point Tuesday.
But there are some slivers of green. Energy stocks (.SPNY) are gaining, while the NYSE FANG+TM index (.NYFANG) is also on the plus side.
With this, S&P 500 growth (.IGX) is on track for its biggest weekly gain vs S&P 500 value (.IVX) since late December of last year.
Here is your early trade snapshot:
(Terence Gabriel)
***** I
THE CLOSER TO UKRAINE, THE HIGHER THE FEAR (INDEX) (0953 EST/1453 GMT)
Europe’s fear index has been much more sensitive to Russia’s invasion of Ukraine than Wall Street’s VIX index as you can see below.
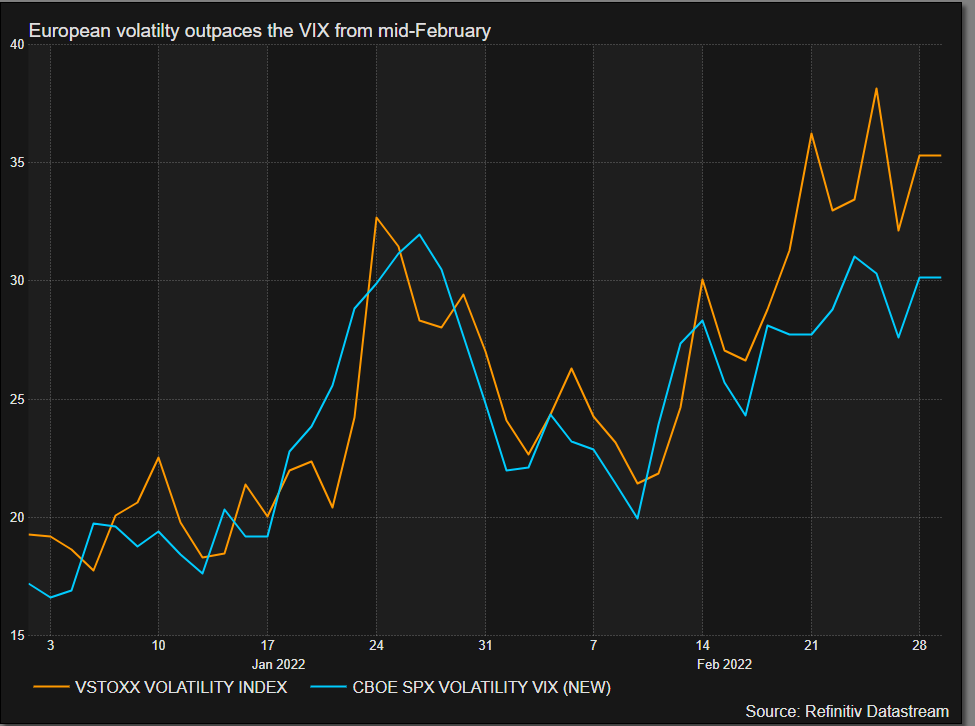
“Perhaps reflective of distance from the current conflict, but the rate of volatility and stress in European equities compared to the US is notable”, Neil Campling, head of TMT research at GTS Group, wrote in a note.
It goes however without saying that European economies have a much bigger exposure to Russia than the U.S. given their great dependence to the country’s oil and gas exports.
And it’s also true that the cost to exit the Russian market will be dire for BP or Shell with many more groups facing costly provisions if they are to shed their units there.
The market stress Austria’s Raiffeisen Bank is under this afternoon in Europe is a good illustration of that.
Some reading on that:
Raiffeisen looks at leaving Russia after Ukraine invasion read more
Which international banks are exposed to Russia? read more
Corporate ties to Russia uprooted as sanctions tighten read more
(Julien Ponthus)
*****
NASDAQ COMPOSITE: BULLS AND BEARS BATTLE IT OUT (0900 EST/1400 GMT)
The Nasdaq Composite’s (.IXIC) daily chart reflects the ongoing battle between bulls and bears, and it appears the tech-laden index is nearing another important juncture:
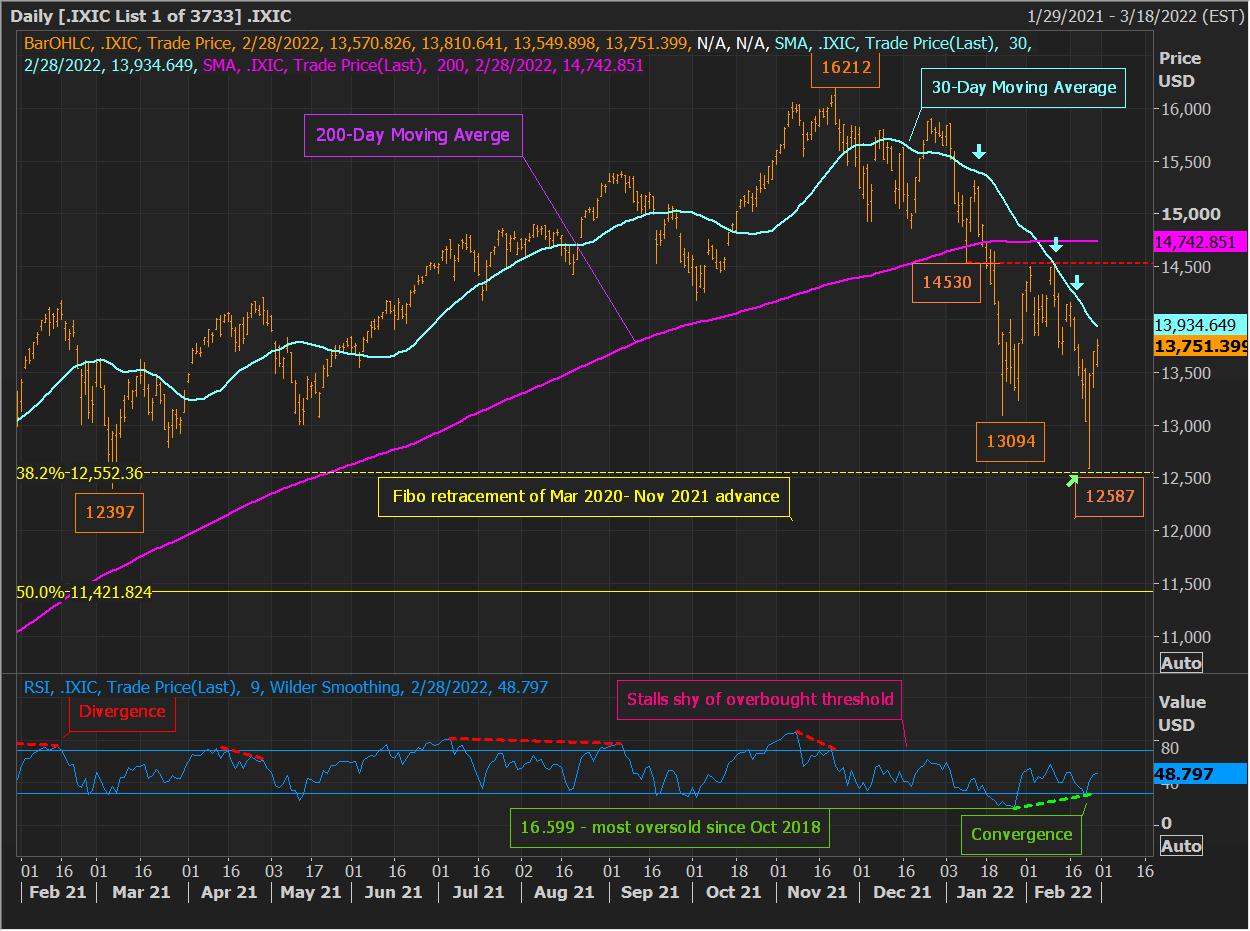
Amid the recent panic, at one point last week the IXIC had collapsed more than 22% from its November 22 record intraday high. read more
That said, there are now some positive signs for bulls. With last Thursday’s panic opening, the Composite hit 12,587.882, nearly tagging the 38.2% Fibonacci retracement of the entire March 2020/November 2021 advance at 12,552.36.
This support level can act as a staging ground for a rally, and like the S&P 500 index (.SPX), with a subsequent snap back, the Composite, by Friday’s close, also managed to form a weekly hammer candle, suggesting the potential for an important low. read more
Additionally, daily momentum is exhibiting a constructive pattern. After falling to its most oversold level since October 2018 in late January, the daily RSI converged into the IXIC’s low last week. A similar pattern ultimately accompanied the Nasdaq’s December 2018, and March 2020, bottoms.
Against this, since diverging into the Composite’s November peak, the RSI has been unable to muster enough strength to reclaim the 70.00 overbought threshold, which is considered to be bearish action.
Also of note, the descending 30-day moving average (30-DMA) has been reinforcing a bearish trend since the Composite broke below it in early January. IXIC probes toward this shorter-term moving average have led to a resumption of weakness followed by lower lows. The 30-DMA ended Monday at about 12,935 and is falling around 25 points per day.
Thus, as for the IXIC’s next significant move, traders will be eyeing IXIC price action and momentum closely in order to help ascertain whether it’s the bulls or the bears who clearly gain the upper hand.
(Terence Gabriel)
*****
FOR TUESDAY’S LIVE MARKETS’ POSTS PRIOR TO 0900 EST/1400 GMT – CLICK HERE: read more
Register now for FREE unlimited access to Reuters.com
Terence Gabriel is a Reuters market analyst. The views expressed are his own
Our Standards: The Thomson Reuters Trust Principles.