- Bitcoin price remains struggling between $36,400 and $46,200 with no directional bias.
- Ethereum price takes steps to sidestep the bearish outlook but has not succeeded yet.
- Ripple price maintains its bullish outlook and eyes a retest of $1.
Bitcoin price saw a massive spike ahead of the Federal Open Market Committee (FOMC) meeting on March 16. The rally was brief, however, and has been undone, suggesting that BTC is likely to head lower before any noticeable uptrends resume. While Ethereum follows the big crypto’s lead, Ripple and other altcoins are likely to take advantage and rally.
Bitcoin price attempts a quick run-up
Bitcoin price has tagged the $36,398 to $38,895 demand zone multiple times and shows no signs of breaking out from this consolidation range. This coiling up of price action for BTC is most likely going to resolve lower if ongoing developments in the traditional markets worsen.
A daily candlestick close below $36,398 will invalidate the said demand zone and open the path for bears to knock BTC down to the weekly support level at $34,752, which is the last line of defense.
A breakdown of this foothold will indicate that Bitcoin price could crash to $30,000 to collect liquidity resting below the equal lows formed in mid-2021.
BTC/USD 1-day chart
While things look bearish for Bitcoin price, a daily candlestick close above $52,000 will create a higher high, invalidating the bearish thesis.
Ethereum price attempts to prevent bearish fate
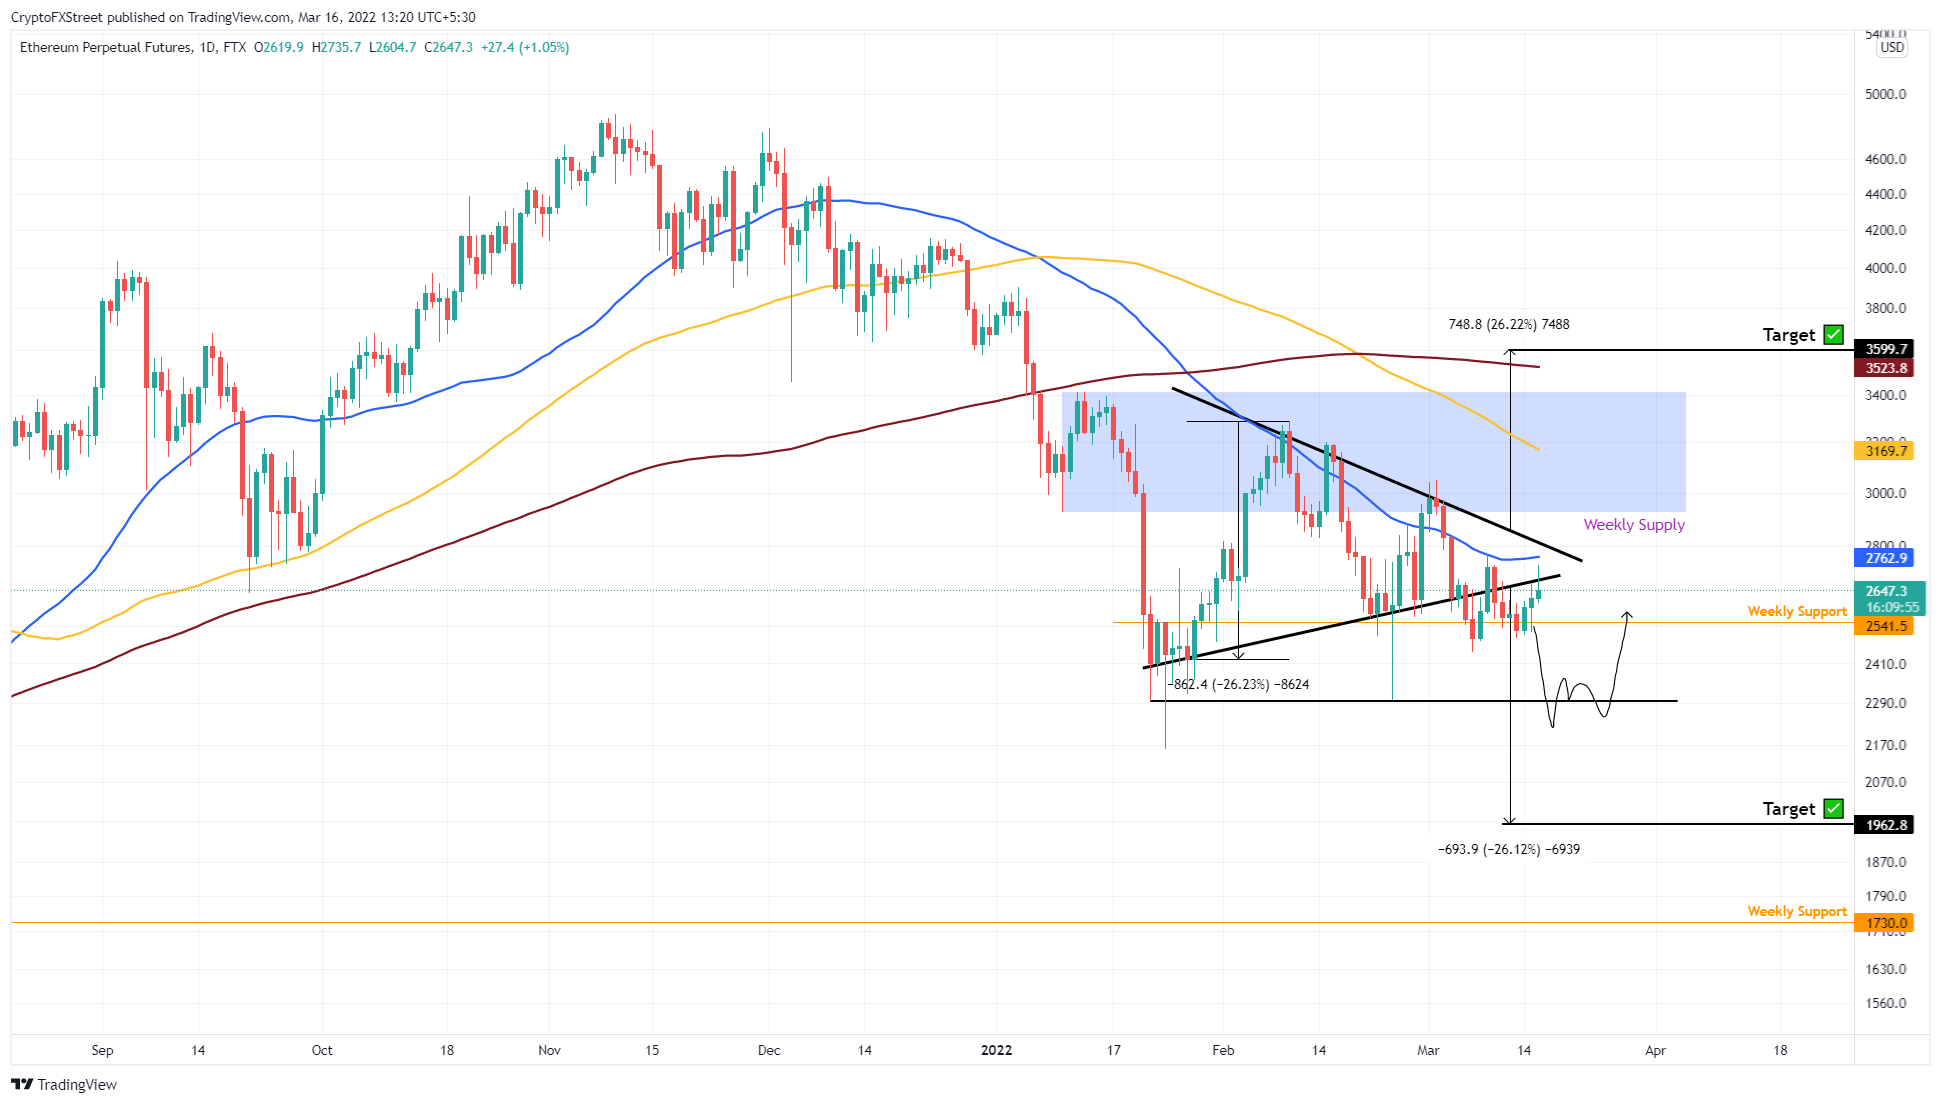
Ethereum price has set up three lower highs and higher lows, which, when connected using trend lines, reveals a symmetrical triangle. This technical formation forecasts a 26% crash to $1,962, obtained by adding the distance between the first swing high and low to the breakout point at $2,631.
ETH already breached the pattern on March 6, but it has had trouble heading lower due to the weekly support level at $2,541. A decisive move below this level could be the key to seeing ETH head down to the $2,000 psychological level or lower.
ETH/USD 1-day chart
A bearish outlook seems the most logical outcome, and a resurgence of buying pressure will have a tough time pushing ETH higher. The resistance levels extending from $2,762 to $3,523 will be a formidable barrier to breach. Only a daily candlestick close above $3,600 will invalidate the bearish thesis for Ethereum price.
Ripple price hangs on
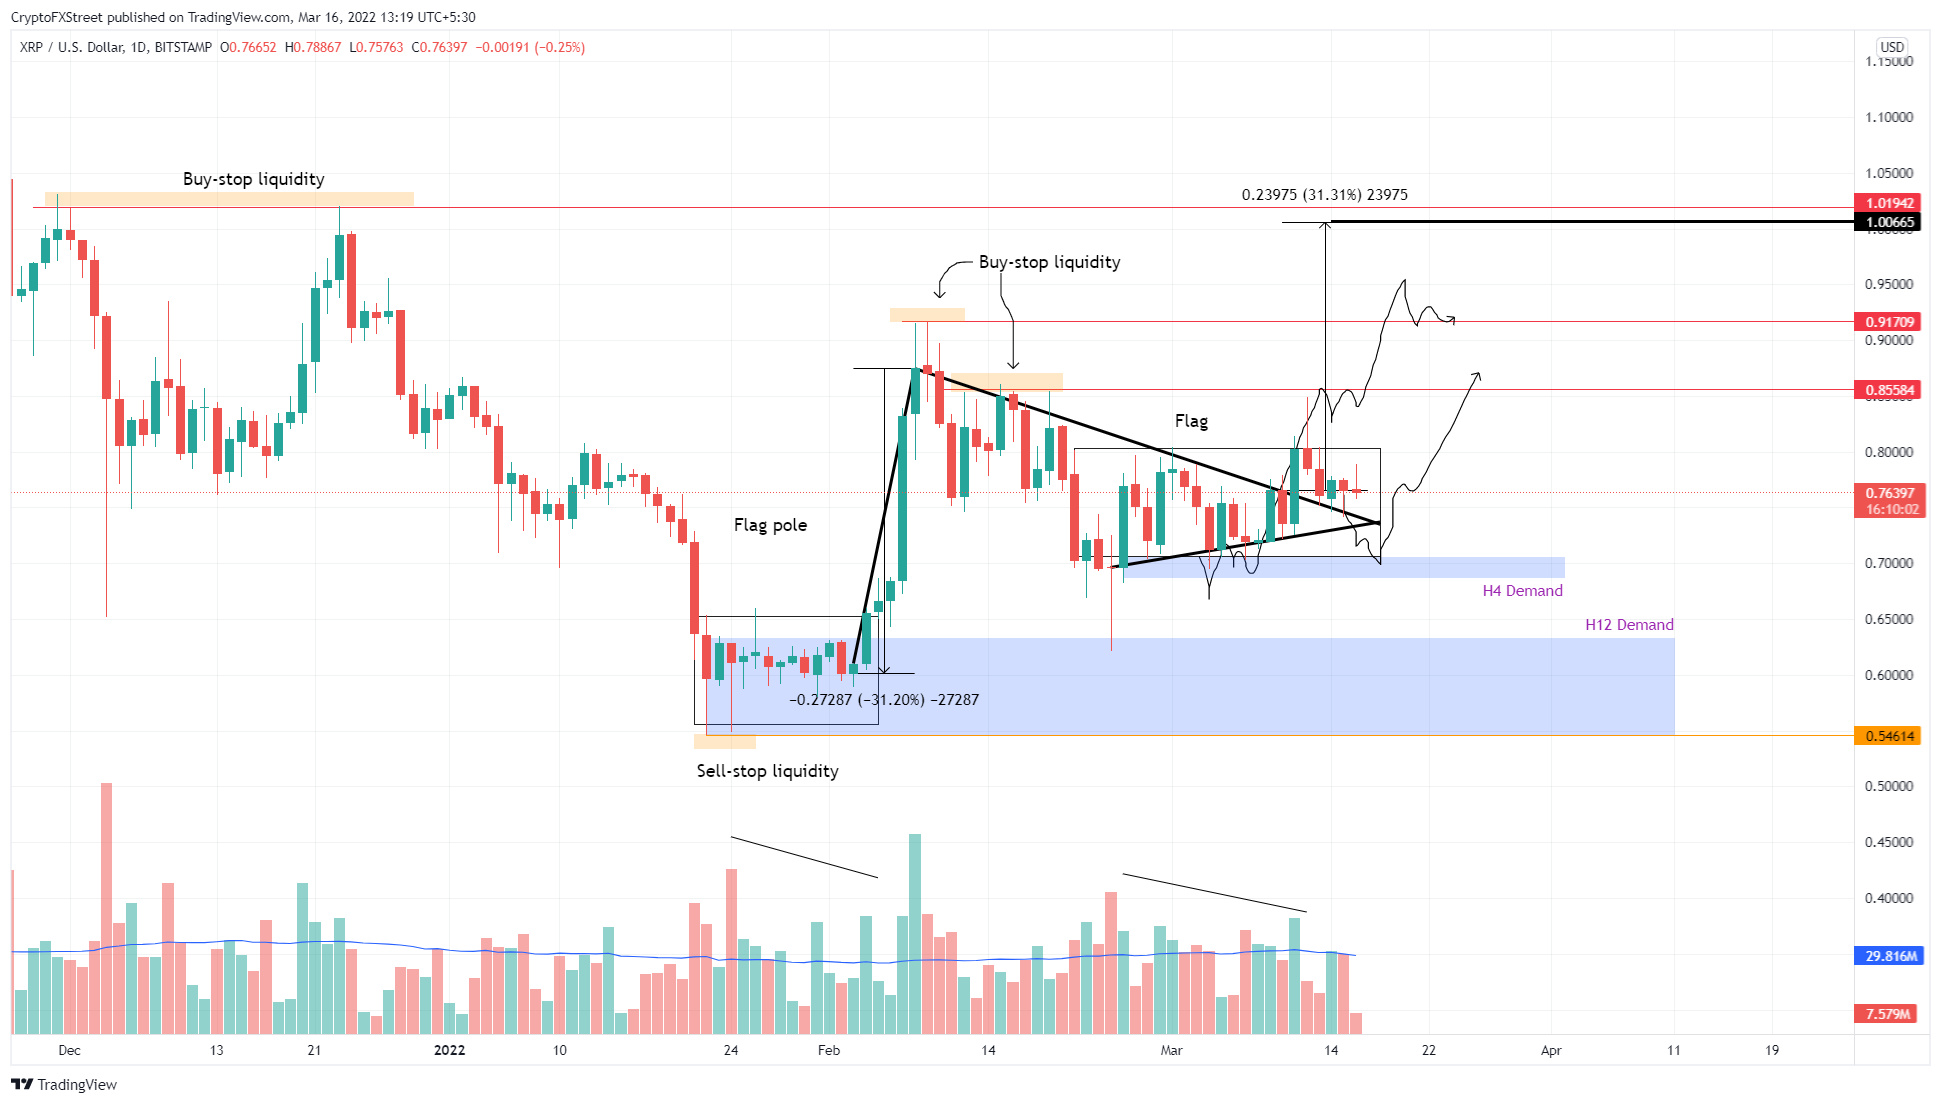
Ripple price formed a bull flag pattern with a bullish outlook – contrary to Ethereum. Moreover, there are multiple support levels starting from $0.705 to $0.546 that suggest less risk of a downside move for the remittance token.
The bull flag forecasts a 31% ascent, obtained by measuring the pole’s length and adding it to the breakout point at $0.767. This technique reveals a target at $1. However, moving to this level will not be easy, and Ripple price might take pit stops at $0.855 and $0.917.
XRP/USD 1-day chart
Regardless of the bullish outlook for Ripple price, it is highly correlated with Bitcoin. Therefore, a crash in BTC could see XRP price head lower as well. Hence, a daily close below the $0.689 support level will invalidate the demand zone and the bull flag hypothesis, and knock XRP to the next support area, extending from $0.546 to $0.633.
Here, buyers will have another chance at a comeback, but failing to hold above $0.546 will create a lower low and further invalidate the bullish thesis.


