
- Bitcoin price has experienced a recent sell-off, pushing it to tag the $36,398 to $38,895 demand zone, with bounce potential.
- Ethereum price is also recovering off a similar support level and a retest of $3,200 is anticipated.
- Ripple price shows recovery is already in progress on the four-hour chart.
Bitcoin price has suffered a setback after crashing in the third week of February. This downswing also knocked Ethereum, Ripple and other altcoins lower. However, BTC seems to be ready for a quick run-up to recover part of the losses suffered.
Bitcoin price eyes reversal
Bitcoin price is currently hovering around the $36,398 to $38,895 demand zone, indicating a recovery rally is around the corner. Assuming BTC bulls can muster the strength, the move will retest the $42,748 resistance barrier, hinting at a 12% ascent.
In some cases, Bitcoin price could extend beyond this level and tag the weekly supply zone’s lower limit at $45,550.
BTC/USD 1-day chart
Regardless of the optimism, if Bitcoin price produces a daily candlestick close below $36,3698, it will create a lower low and invalidate the bullish thesis.
Ethereum price upside remains capped
Ethereum price is currently ricocheting off the daily demand zone, stretching from $2,160 to $2,567, indicating that a quick rally seems likely. The first hurdle ETH will encounter is the 50-day Simple Moving Average (SMA) at $2,925. Clearing this level will open the path for retesting the daily supply zone, extending from $3,188 to $3,393.
Clearing this massive blockade could send ETH to roughly $3,600, a crossover point of the 200-day and 100-day SMAs. This barrier is where Ethereum price upside is capped at.
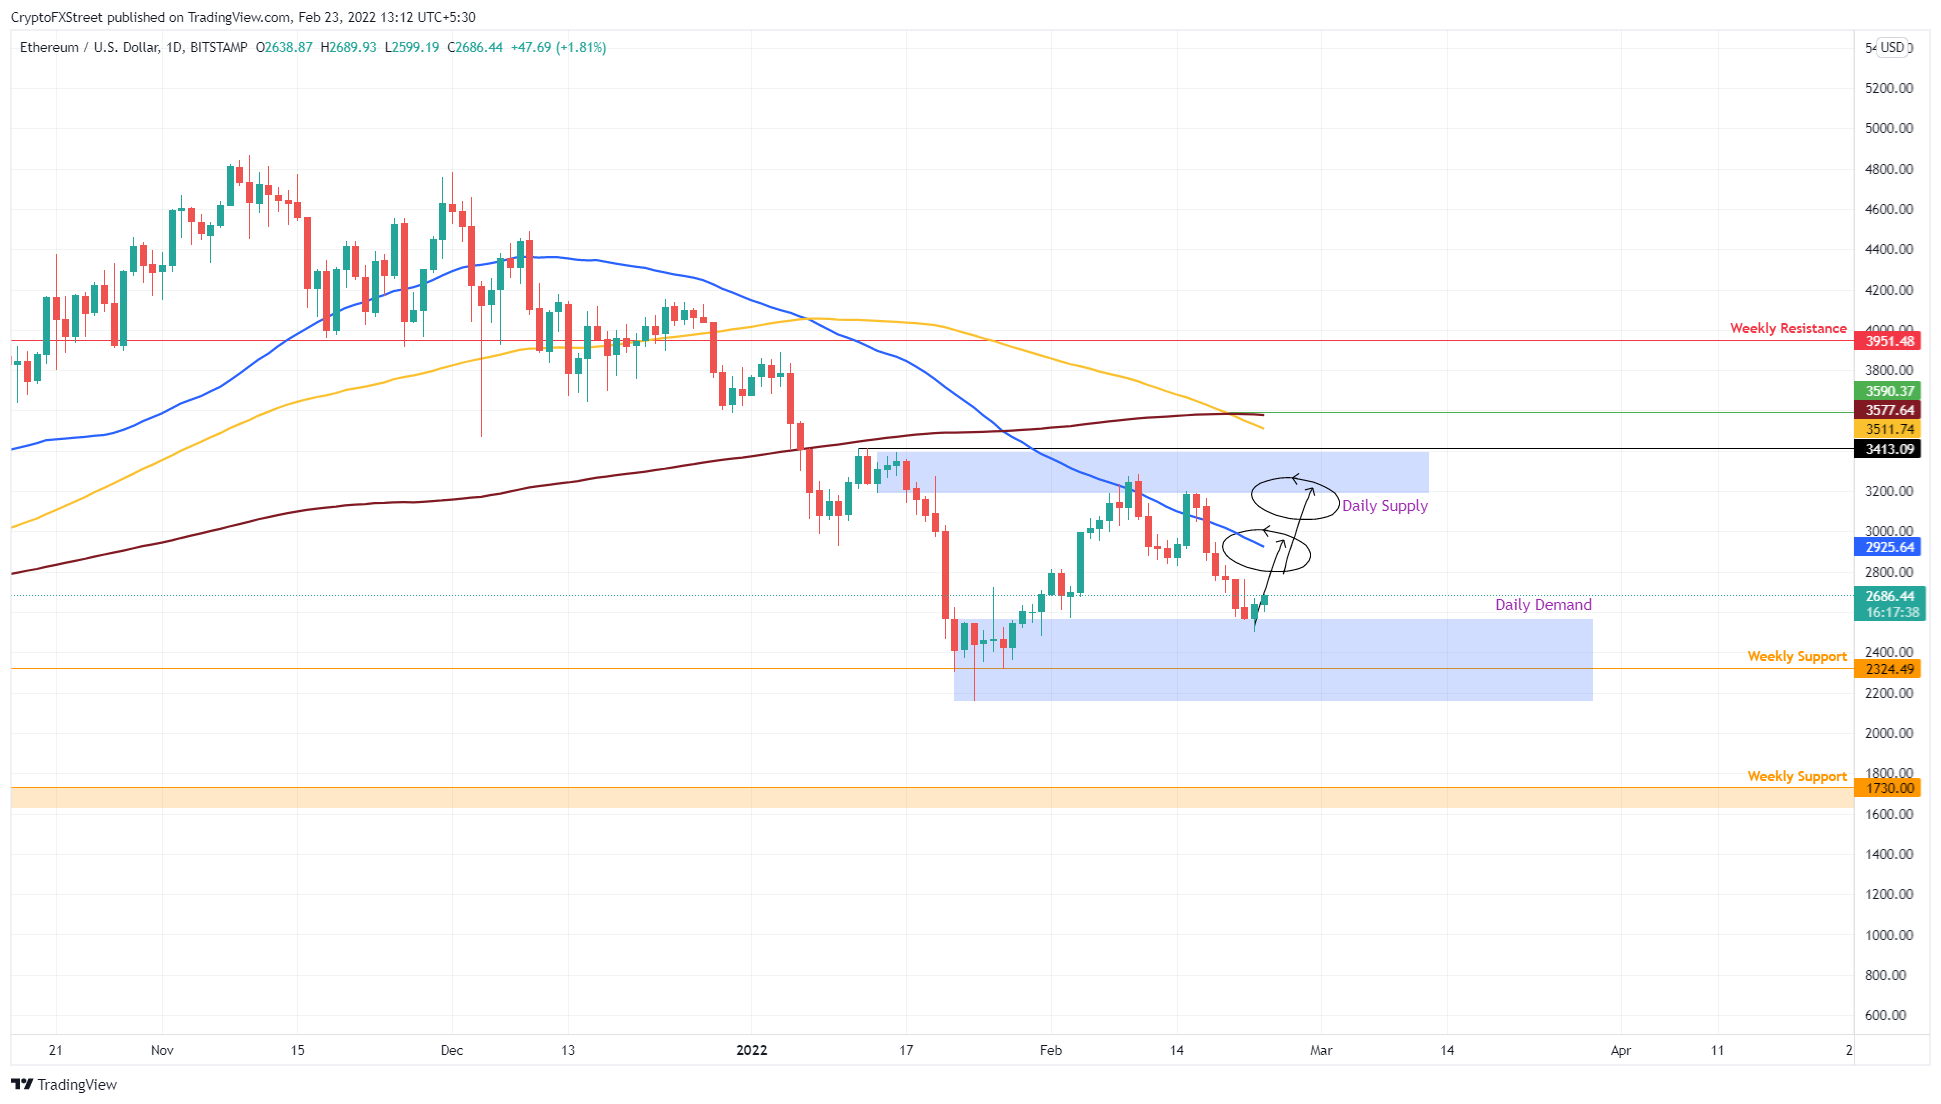
ETH/USD 1-day chart
Similar to Bitcoin’s situation, if Ethereum price produces a daily candlestick close below $2,160, it will end the bullish thesis. In this situation, ETH might retrace lower and tag the $1,730 support floor.
Ripple price to return to the pavilion
Ripple price dropped 16% between February 21 and 22, tagging the $0.650 to $0.677 demand zone. Now buyers seem to be making a move, however, since the XRP price has rallied 8% after piercing the aforementioned support level.
This bounce is likely to continue pushing the remittance token higher till it retests the $0.778 resistance barrier. The climb would represent a 10% total gain from the current position. In some cases, a potential spike in buying pressure could extend the Ripple price upswing to $0.813.
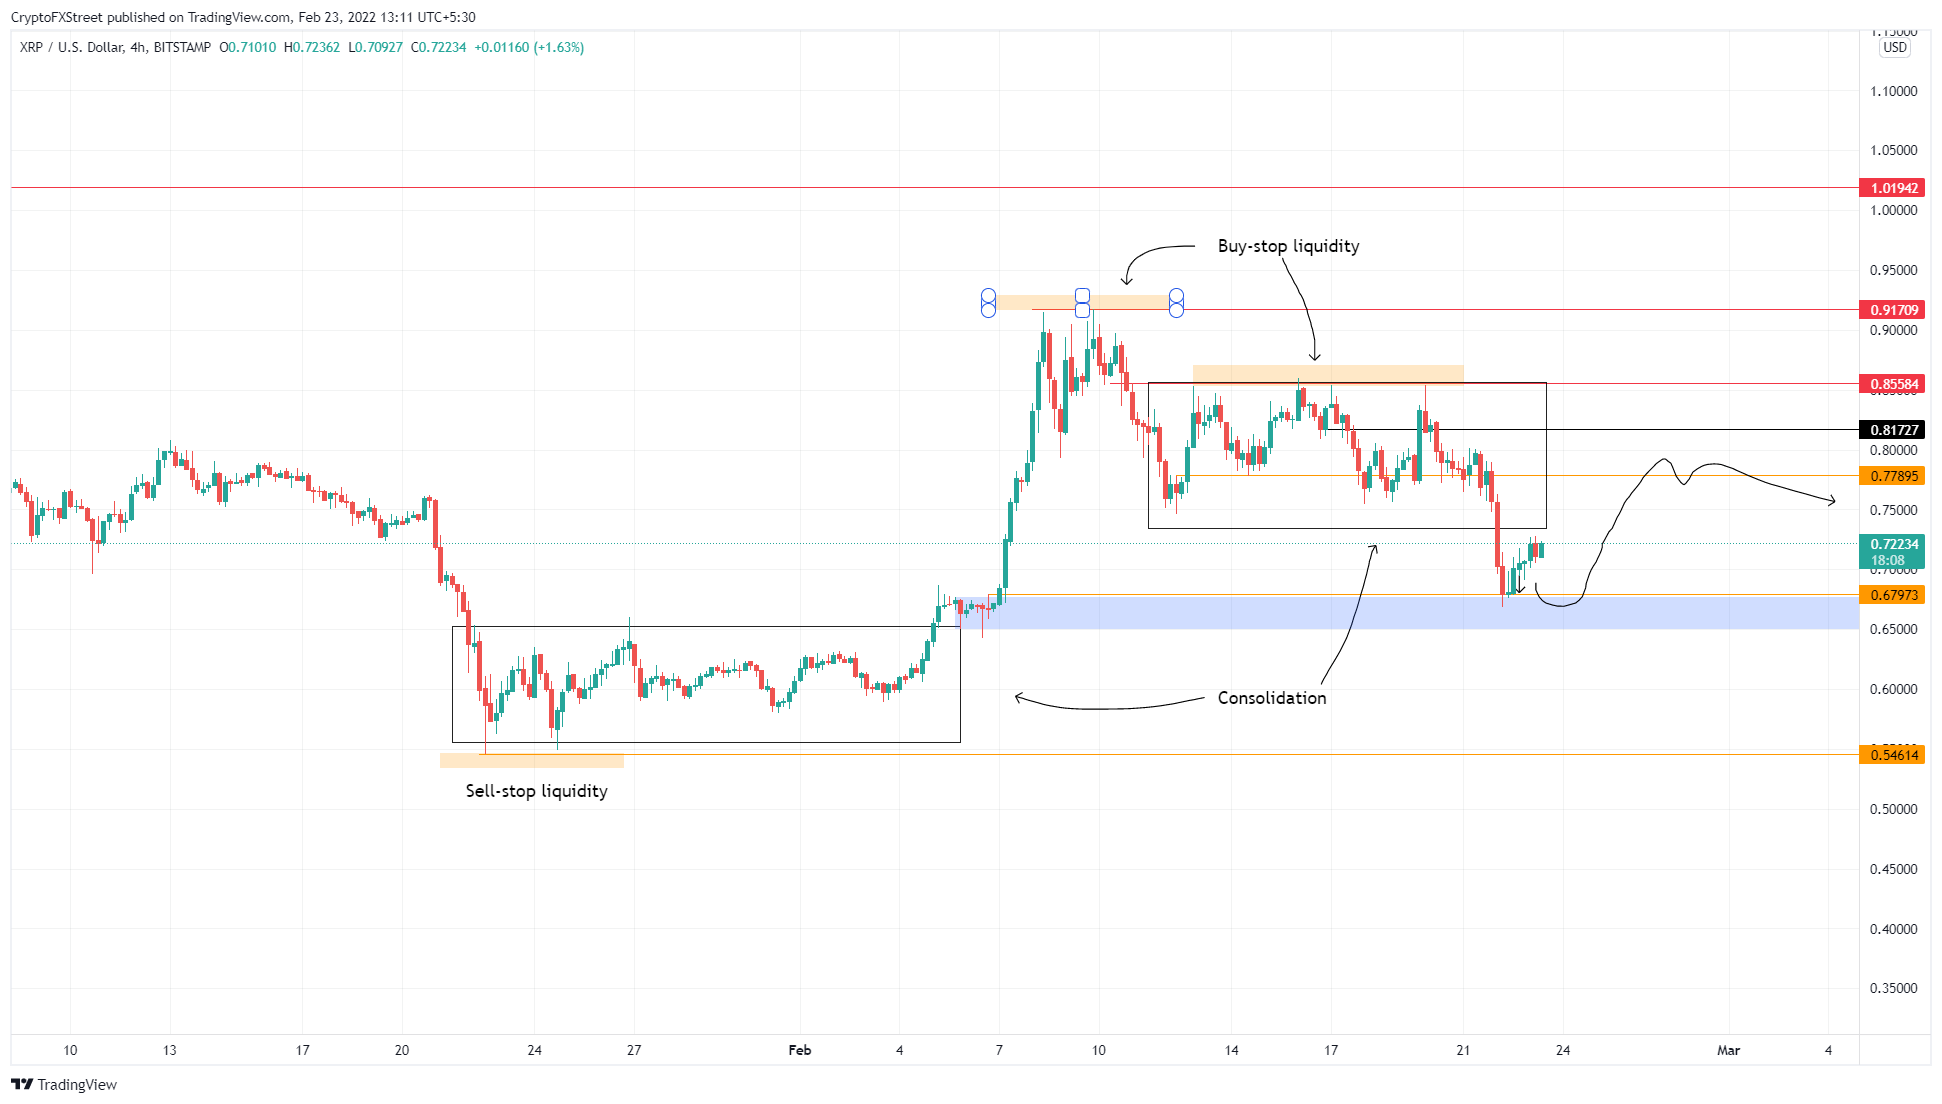
XRP/USD 4-hour chart
While things are looking up for Ripple price, a breakdown of the $0.650 support level will create a lower low, invalidating the bullish thesis. This development will open Ripple’s path to the $0.546 support level, where buyers are likely to attempt another comeback.