
Bitcoin Analysis Monday
The price of Bitcoin he closed his daily candle in green for the fourth time in five days and he has finished Monday’s daily session at + $ 587.
The first chart we look at today is the 1-day BTC / USD chart below from RSibayan. The price of BTC broke above $ 38.5k on Monday and bullish BTC traders are now hoping to actually test the higher resistance closer to $ 40k. If bullish traders are able to actually penetrate the $ 40k level to the upside, they will shift their focus to their secondary target at the 0.236 fib level. [$41.445,06].
The bears are trying to defend the 0.236 fib and send the BTC price down again to test the bottom of the current 0 range. [$32.933,33]. If BTC bearish traders manage to break out of this level, the next major support for bullish traders is not before the $ 29k level which is where BTC price pivoted after making its initial top just below $ 65k in the 2021.
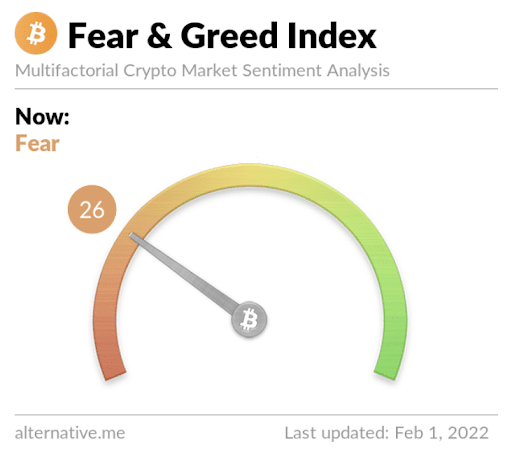
The Fear and Greed Index is 26 Fear and +6 from yesterday’s reading of 20 Extreme Fear.
Bitcoin Moving Averages: 20-Day [$40.378,3]50-Day [$46.519,12]100-Day [$51.264,66]200-Day [$46.405,63]Year to Date [$40.902,6].
BTC’s 24-hour price range is $ 36,831- $ 38,715 and the 7-day price range is $ 35,622- $ 38,715. Bitcoin’s 52-week price range is 29,341- $ 69,044.
Bitcoin’s price on this date last year was $ 33,405.
The average price of BTC over the past 30 days is $ 41,025.
The price of Bitcoin [+1,55%] closed its daily candle on Monday for a value of 38,526 dollarsbut he painted one bearish engulfing candle on the monthly time scale.
Ethereum analysis
The price of Ether has also risen Monday for the fourth consecutive day and closed at + $ 84.06.
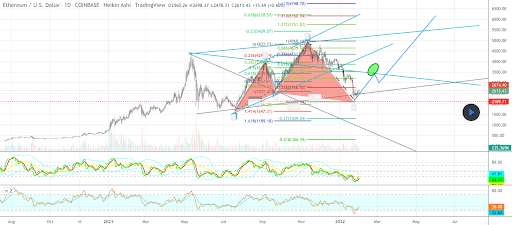
The second chart we look at today is the 1-day ETH / USD chart TommyMullings. The price of Ether is currently trading between 0 [2.086,98 dollari] and 0.236 [2.766,92 dollari]. If Ether’s bullish traders manage to break out of the 0.236 fib level, they have a secondary target of 0.382 [3.187,57 dollari] and a third target of 0.5 [3.527,55 dollari].
Bearish traders hope to keep bullish traders at 0.236 at bay and postpone ETH price down to retest a full retracement to 0 [$2.086,98]. If the bears manage to break through 0.236 they have a secondary goal of 1.414 [$1.647,41] and a third target of 1.618 [$1.189,18].
Moving Averages of Ether: 20-Day [$2.957,73]50-Day [$3.638,65]100-Day [$3.745,45]200-Day [$3.256,57]Year to Date [$3.032,19].
The 24-hour ETH price range is $ 2,499- $ 2,703 and the 7-day price range is $ 2,353- $ 2,703. Ether’s 52-week price range is $ 1.353- $ 4.878.
The price of ETH on this date in 2021 was $ 1,368.
The average price of ETH over the past 30 days is $ 3,041.
The price of Ether [+3,23%] closed the daily candle on Monday $ 2,686.66but also suffered a bearish engulfing due to the close of the monthly candle in January.
Luna analysis
The price of LUNA has gone up with most of the cryptocurrency market on Monday and closed its daily candle at + $ 5.71.
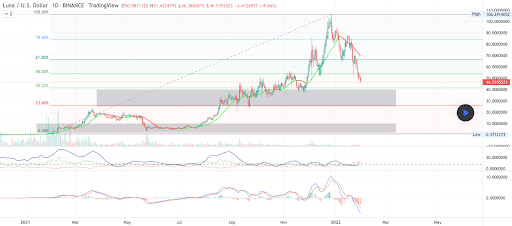
The 1-day LUNA / USD chart below from traderramp shows that the price of LUNA is currently trading between the 38.20% fib level [$41,41] and the level 50.00% fib [$53,77]. If LUNA’s bullish traders manage to break out of 50.00% fib they will aim at the 61.80% level [$66,43].
LUNA bearish traders are looking to push back the bulls before or at the 50.00% level and send the LUNA price down again to test 38.20% fib with a secondary target at the bottom of that decline level at 23, 60% fib [$26,28].
Moving Averages of LUNA: 20-Day [$69,77]50-Day [$70,67]100-Day [$54,51]200-Day [$33,36]Year to Date [$71,50].
The Earth 24-hour price range is $ 43.67- $ 52.13 and the 7-day price range is $ 43.67- $ 66.36. LUNA’s 52-week price range is $ 1.79- $ 103.34.
Terra’s price on this date last year was $ 1.79.
The average price of LUNA over the past 30 days is $ 71.48.
The price of Earth [+12,31%] it’s over in red for six of the past eight daysbut made a bullish engulfing candle on the daily time frame on Monday. The price of LUNA ended the daily session at $ 52.10.