
- Bitcoin price has seen a 10% rally over the past week, reaching the $38,800 peak.
- Ethereum price followed suit and climbed 14% and is currently pausing its uptrend.
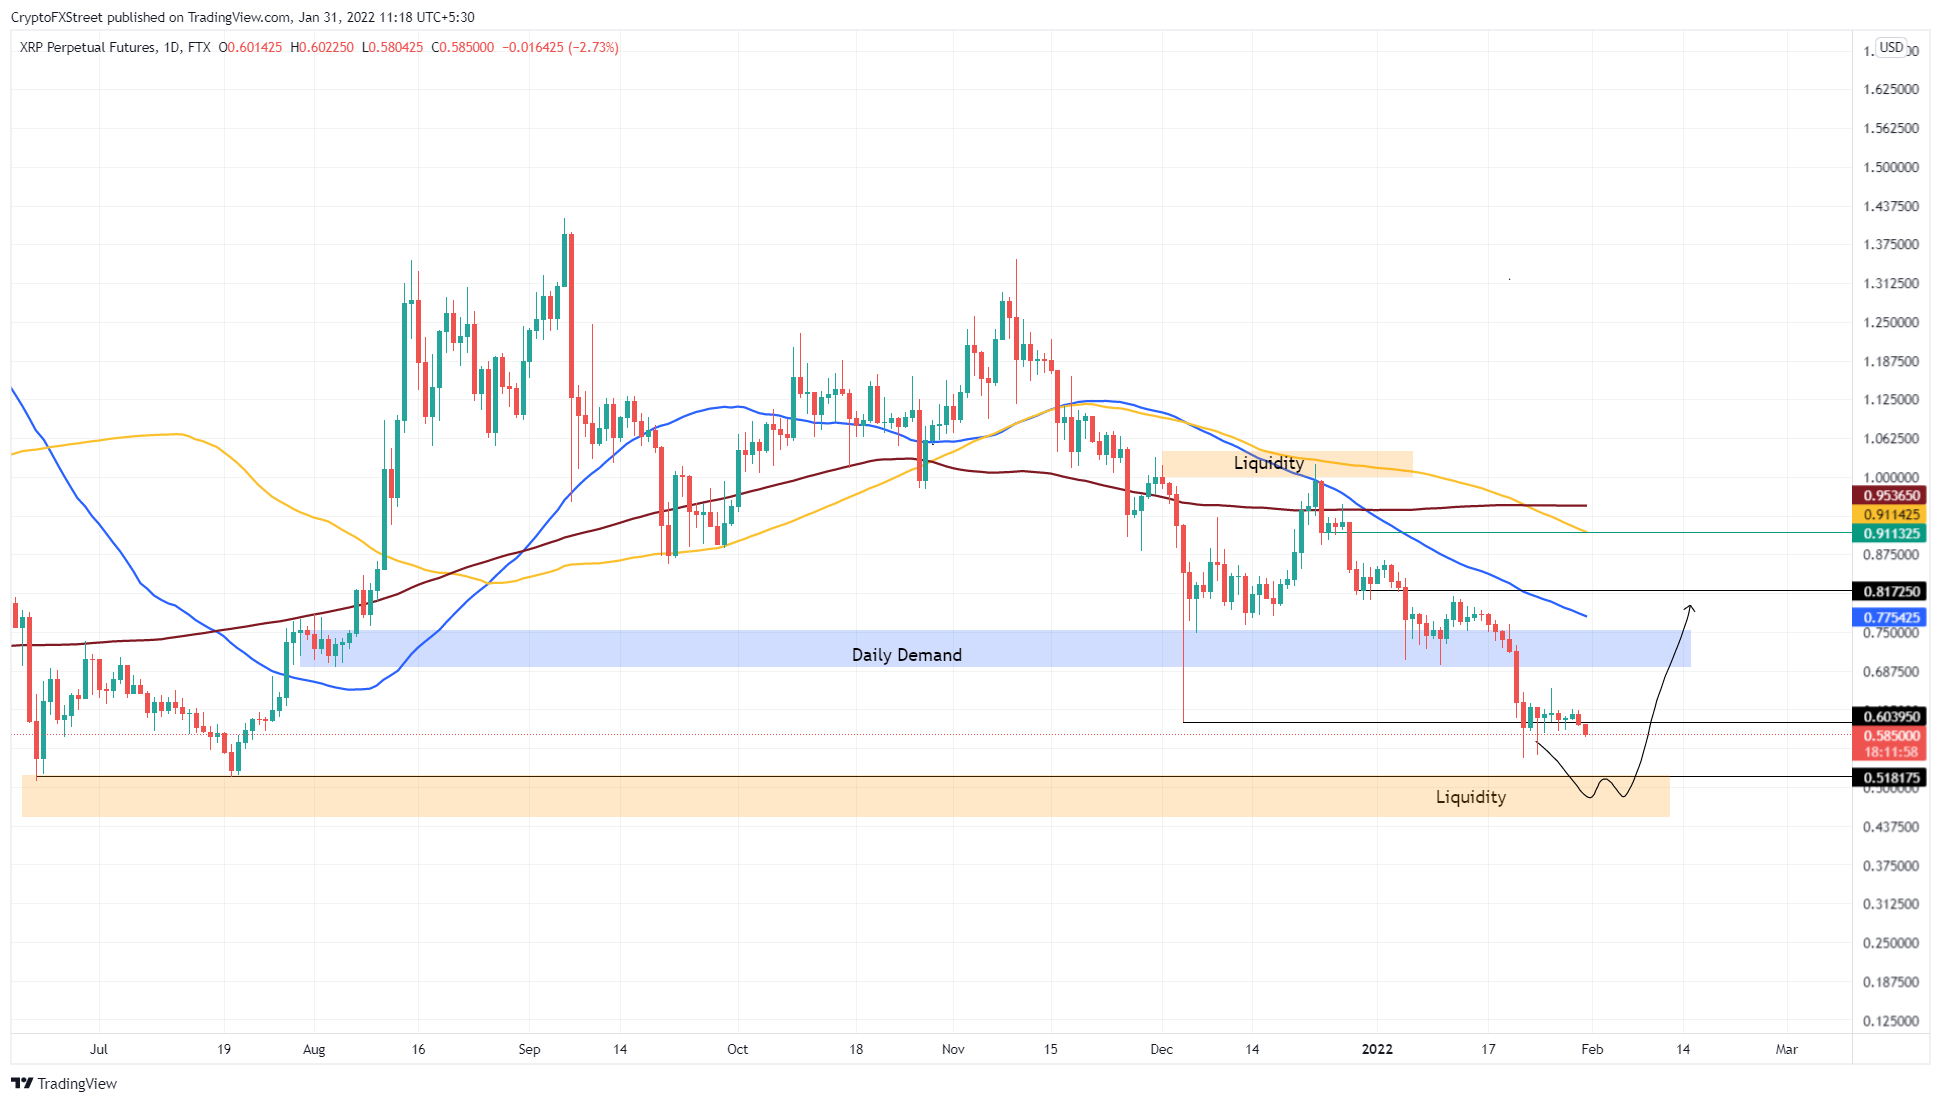
- Ripple price goes against the trend and slides lower, hinting at liquidity run below $0.518.
Bitcoin price seems to have encountered a massive support level that has stopped the downtrend in its track and resulted in a quick bounce. This trend seems to be witnessed across Ethereum and many altcoins but in different magnitudes. Ripple seems to be defying the ongoing trend and is showing an affinity to head lower.
Bitcoin price explores recovery
Bitcoin price crashed 25% from $43,527 to $32,83 from January 20 to January 24, bringing the altcoins down with it. However, the downswing seems to have found a stable support level at $34,752, stopping it from worsening the situation.
BTC set up a base around this barrier, resulting in a relief 10% rally. BTC rallied roughly 19% from trough to peak over the past week and is currently experiencing a slowdown. A pullback seems likely before a new uptrend originates, propelling the big crypto to $40,794, the lower limit of the supply zone.
The upside for Bitcoin price seems to be capped at this barrier and any move beyond this hurdle will likely be undone violently. Therefore, investors need to exercise caution beyond $40,794.
BTC/USD 1-day chart
Regardless of the bullish outlook, if Bitcoin price produces a daily candlestick close below $34,752, it will create a lower low, invalidating the bullish thesis. This development could see BTC head to $29,100.
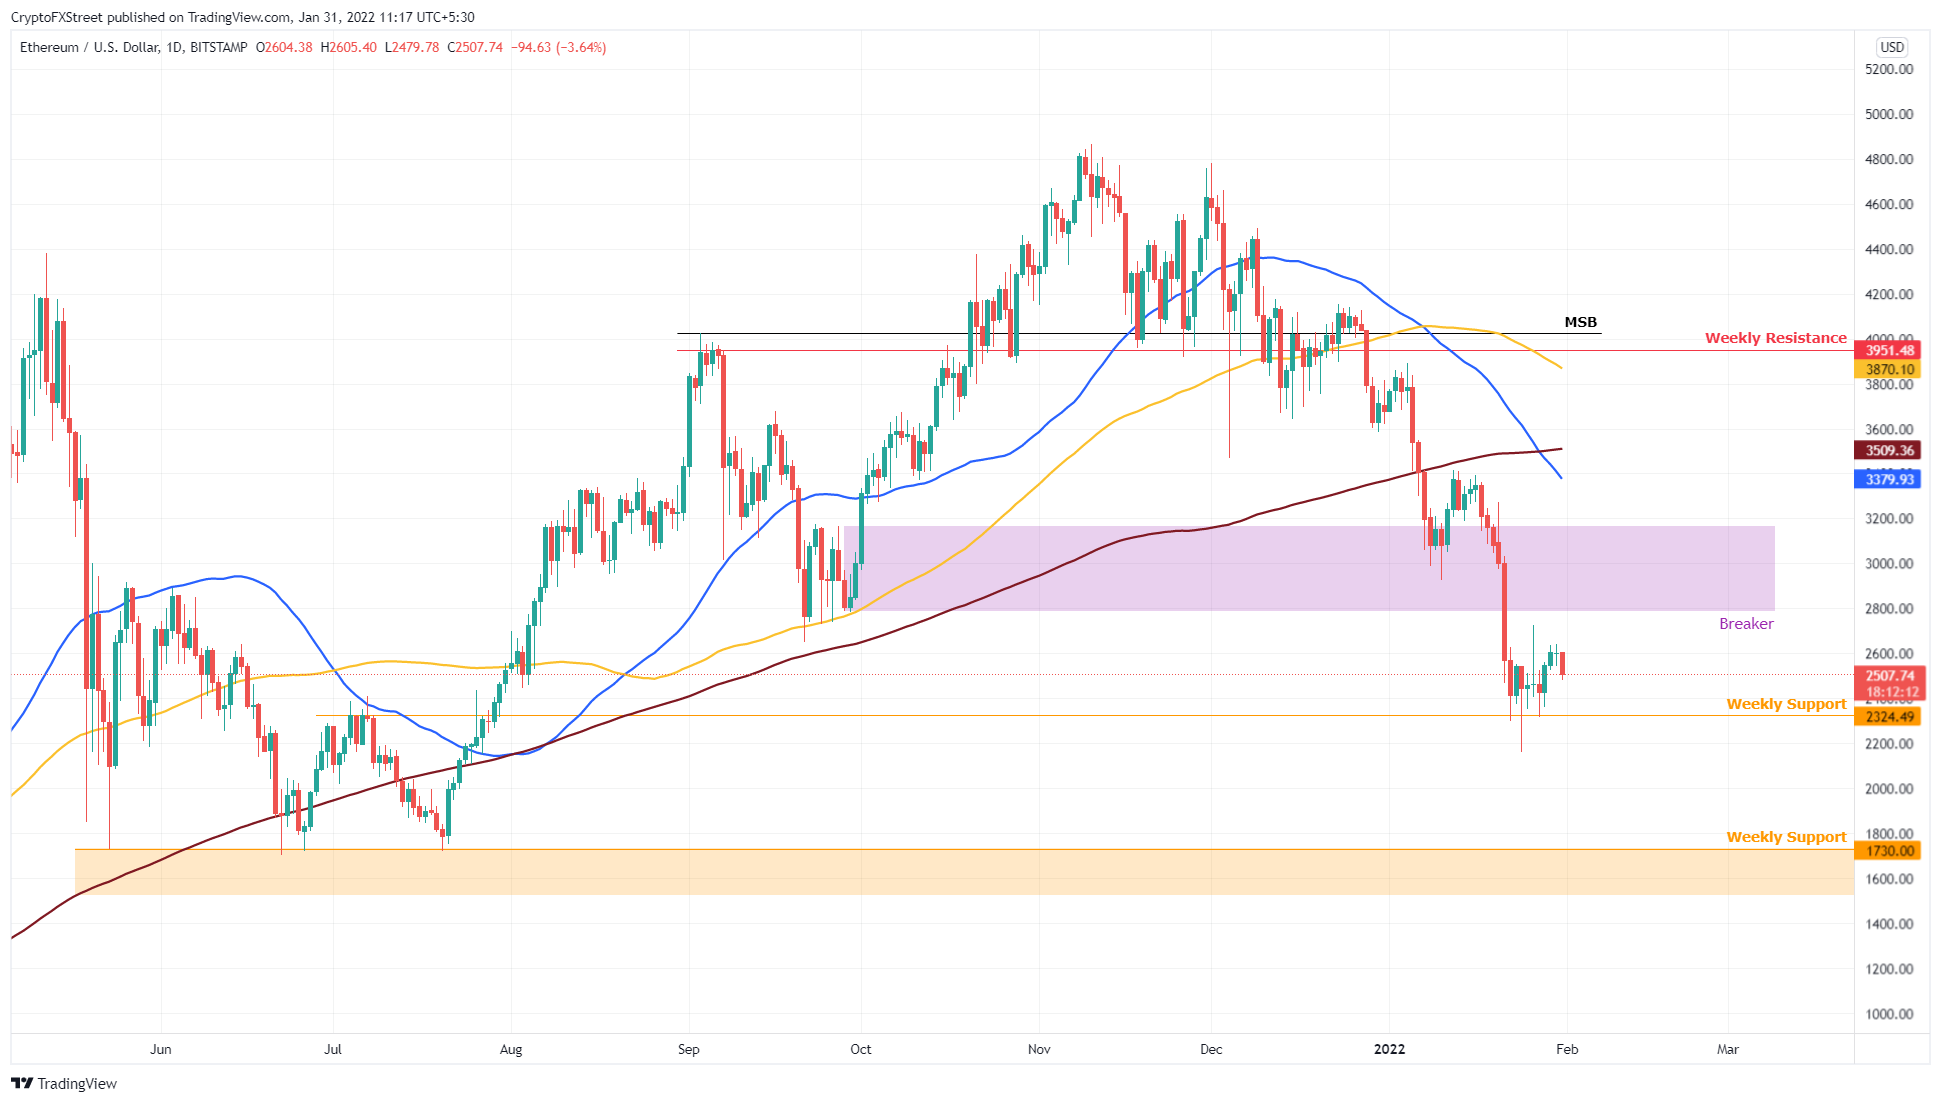
Ethereum price pauses relief rally
Ethereum price dropped 33% as it followed BTC through the flash crash. ETH also found a weekly support level at $2,324 that cauterized the bleeding and initiated a relief rally. Since then, ETH surged 20% and is currently experiencing a pullback.
The upside for Ethereum price seems to be capped at the lower limit of the supply zone, which extends from $2,789 to $3,167. This development leaves room for ETH to bounce another 12%. Any move into this barrier will likely be reversed quickly and violently.
ETH/USD 1-day chart
While things are looking up for Ethereum price despite the capped upside, a breakdown of the $2,324 support barrier will create problems. A daily candlestick close below this barrier will indicate a continuation of the downtrend and invalidate the bullish thesis.
This development could see ETH head to $1,730 or lower.
Ripple price remains the odd one out
Ripple price seems to be leaning towards another downswing as it slices through the $0.604 support level. A continuation of this trend could see XRP price revisit the $0.518 barrier and possibly sweep below it to collect the sell-side liquidity.
This development will complete the triple bottom setup and could be the key to triggering a massive uptrend for the remittance token. The resulting uptrend could see Ripple price make a move to retest the $0.694 hurdle, signaling a 35% ascent from the current position.
XRP/USD 1-day chart
On the contrary, if the Ripple price recovers above the $0.60 support level, there is a good chance the XRP price will attempt to retest the $0.694 barrier. However, a prolonged stay below the $0.518 barrier will indicate a lack of buying pressure and invalidate the triple bottom bullish thesis.