
- Bitcoin price retests the weekly support level at $34,752 after crashing 22% over the past four days.
- Ethereum price has breached through a crucial support area as it visits the $2,324 foothold.
- Ripple price hovers around the $0.60 support level as market makers eye liquidity resting below $0.52.
Bitcoin price has witnessed a massive crash over the past week, undoing the gains seen since July 25. Ethereum, Ripple and other altcoins have followed suit, experiencing an even worse crash.
Bitcoin price gets a much-needed respite
Bitcoin price has dropped 22% over the past four days, allowing it to retest the weekly support level at $34,752. While there is a chance BTC might see some sort of a bullish recovery from here, a breakdown of the said support seems inevitable, at least from a market makers’ perspective. One reason why Bitcoin price is likely to revisit $30,000 or lower is the liquidity resting below the $29,100 foothold, so, investors can expect BTC to continue its descent in the coming days.
BTC/USD 1-day chart
While things are looking grim for Bitcoin price, a pessimistic outlook can be avoided if BTC produces a daily candlestick close below $45,236.
Ethereum price at a decisive moment
Ethereum price has sliced through the $2,650 to $3,347 demand zone, flipping it into a breaker. While this development is bearish, ETH has a weekly support level at $2,324, protecting it from further descent.
A breakdown below this foothold could push ETH down to $1,730 and the sell-side liquidity resting below it and this could prompt further losses. Investors can expect ETH to stabilize around this level and form a base that restarts the uptrend.
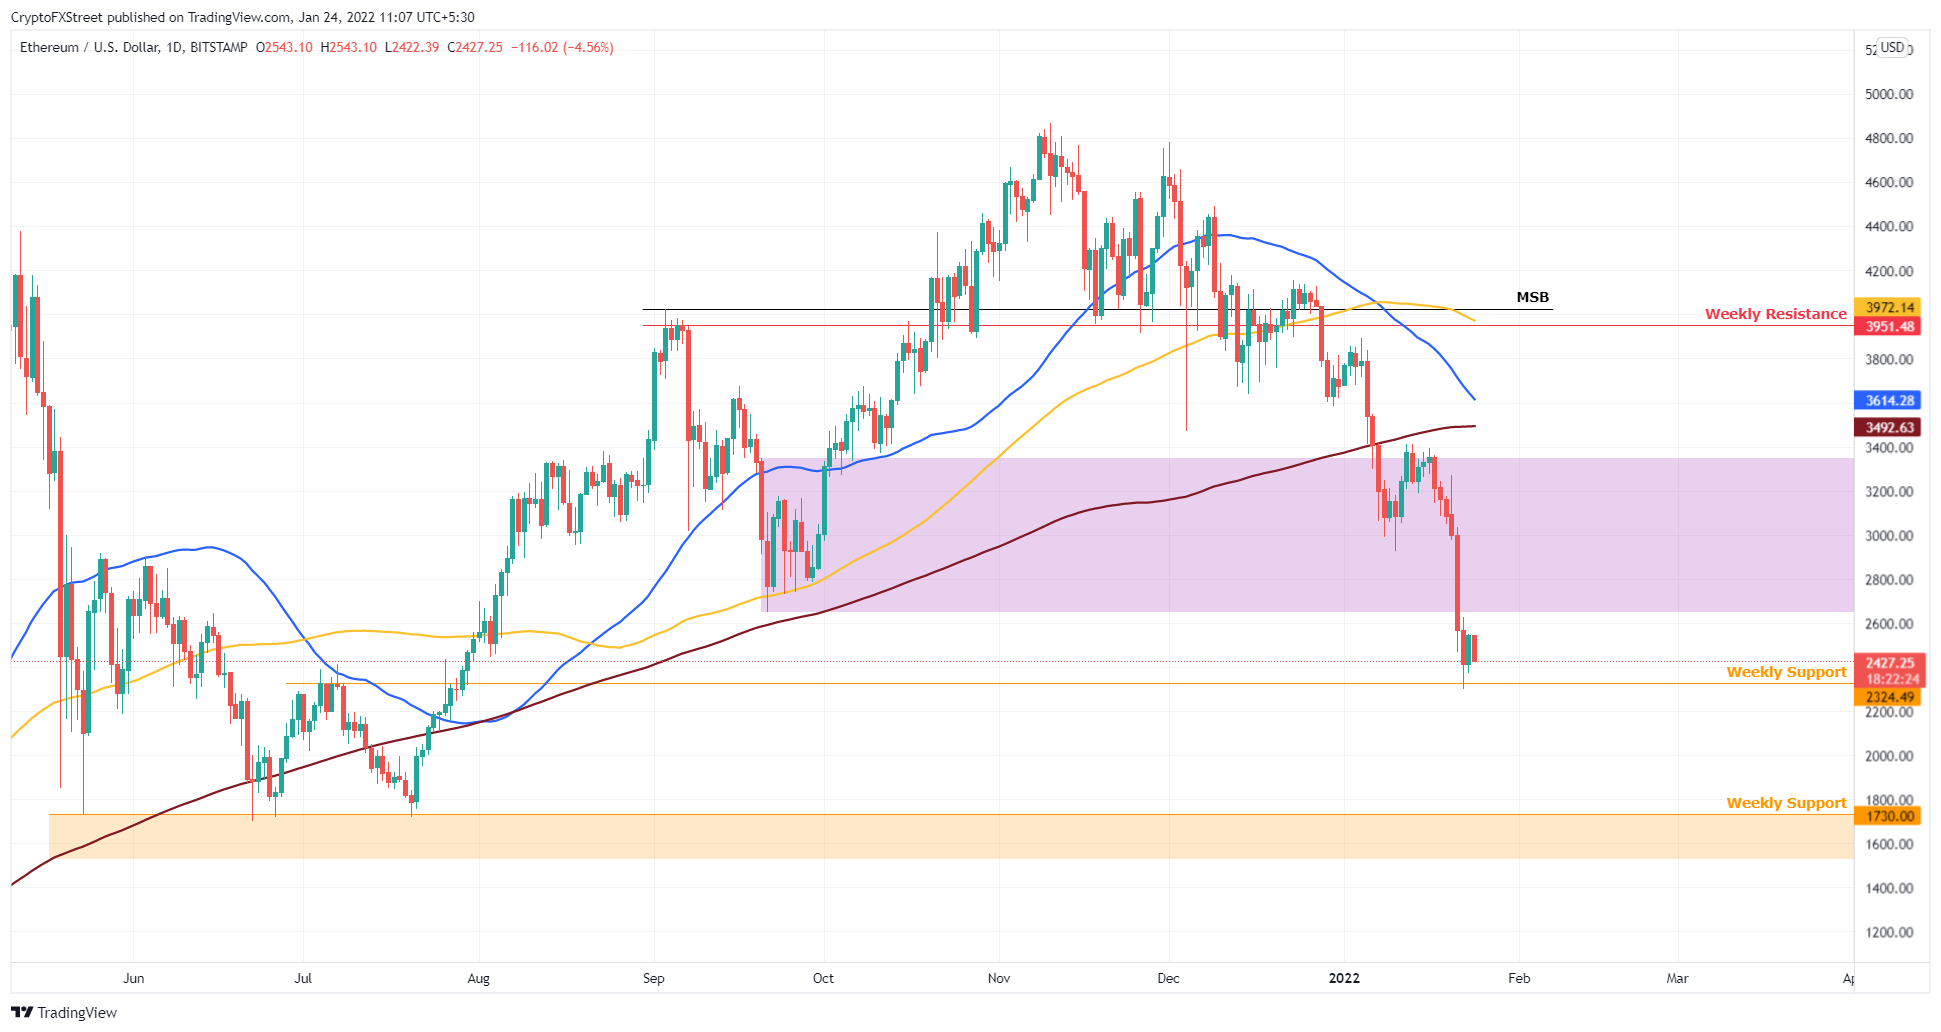
ETH/USD 1-day chart
On the other hand, if Ethereum price sees a potential spike in buying pressure that pushes ETH to produce a daily candlestick close above $3,347 this will invalidate the bearish thesis. The development could trigger ETH to retest the 200-day Simple Moving Average (SMA) at $3,492 and the 50-day SMA At $3,614.
Ripple price to slide lower
Ripple price has sliced through the $0.694 to $0.75 demand zone, indicating an increase in selling pressure. The downswing has pushed the XRP price to retest the $0.604 support level. The remittance token is likely to consolidate in this area before market makers crash XRP price to $0.518, to collect the sell-stop liquidity resting below it.
This outlook seems extremely similar to the development taking place with Bitcoin and Ethereum. Due to the massive correlation of ETH and XRP to BTC, a crash in big crypto’s market value will be seen across most of the altcoins including Ripple.
Investors should, therefore, be prepared for Ripple price to revisit $0.518 or lower.
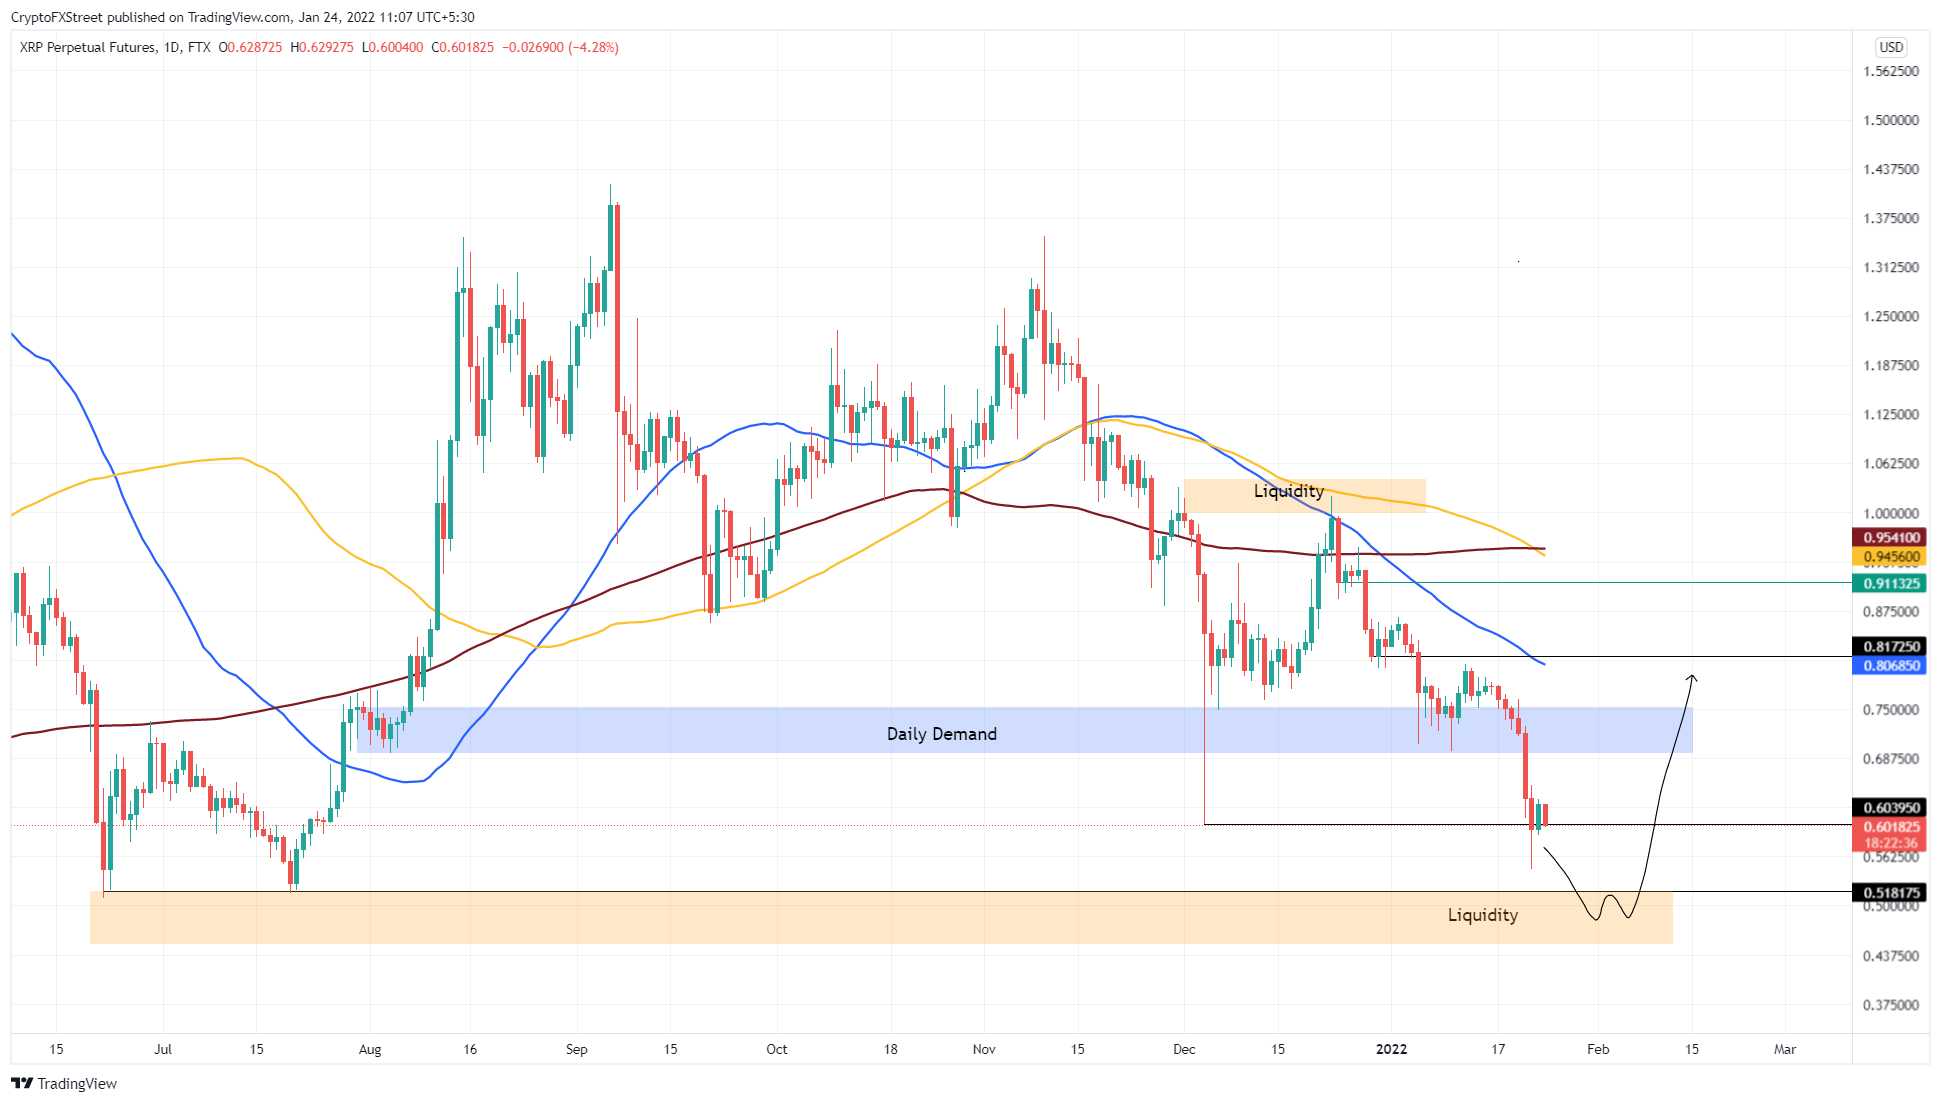
XRP/USD 1-day chart
Regardless of the bearish outlook depicted by Ripple price, a daily candlestick close above the 50-day SMA at $0.807 will invalidate the bearish outlook. This development could see XRP price revisit the $0.954 barrier where the 200-day and 100-day SMA crossover.