Key Takeaways
- Bitcoin appears to be forming a market bottom.
- Likewise, Ethereum has entered the “opportunity zone.”
- BTC and ETH must break resistance to march to new all-time highs.
Share this article
Bitcoin and Ethereum appear bound for high volatility as several on-chain metrics suggest that a market bottom is near. Still, these cryptocurrencies must overcome a significant obstacle to resume the uptrend.
Bitcoin in Accumulation Mode
Bitcoin appears to be trading in oversold territory while crypto enthusiasts remain fearful of further losses.
Bitcoin’s Entity-Adjusted Dormancy Flow suggests that the flagship cryptocurrency could be forming a local bottom. It considers the ratio of the current market capitalization to the annualized dormancy value to determine whether experienced market participants are spending their BTC.
Whenever there is a substantial decrease in spending from the so-called “old hands,” the Entity-Adjusted Dormancy Flow drops below the 250,000 threshold, representing an excellent historical buy zone. This on-chain metric has almost perfectly timed every market bottom since 2011, and a similar outlook could now play out as dormancy value has overtaken market capitalization.
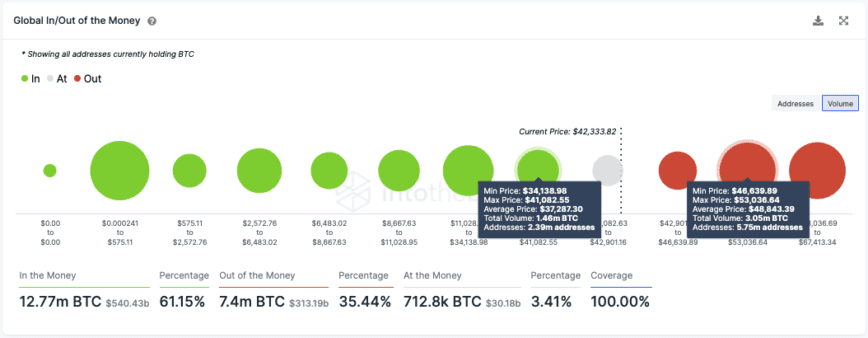
Still, IntoTheBlock’s Global In/Out of the Money model reveals that Bitcoin faces stiff resistance ahead. Approximately 5.75 million addresses had purchased more than 3 million BTC between $46,700 and $53,000.
Only a substantial break above this supply barrier can confirm that the pioneer cryptocurrency will resume its bull market.

It is worth noting that Bitcoin currently trades above a thin layer of support. Roughly 2.4 million addresses hold nearly 1.5 million BTC between $34,000 and $41,000. Such a vital demand wall must hold to prevent the bellwether cryptocurrency from capitulating to $30,000 or even $20,000.
Ethereum in Opportunity Zone
Ethereum appears to have entered an accumulation zone, encouraging sidelined investors to get back in the market.
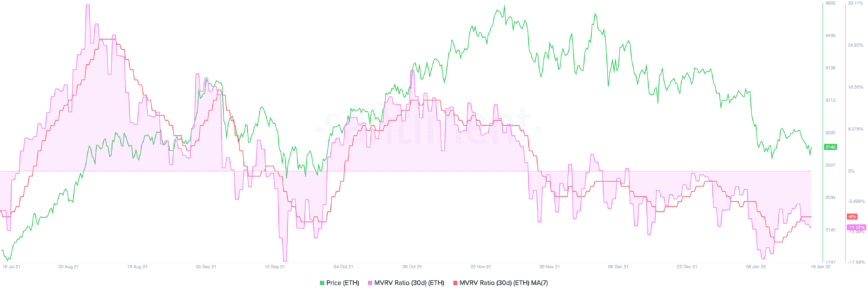
The Market Value to Realized Value (MVRV) index suggests that Ethereum is undervalued at the current price levels. This fundamental index measures the average profit or loss of addresses that acquired ETH over the past month.
The 30-day MVRV ratio currently hovers at -11.12%, indicating that Ethereum sits in the “opportunity zone.” The lower the MVRV ratio, the higher the probability of an upward price movement.

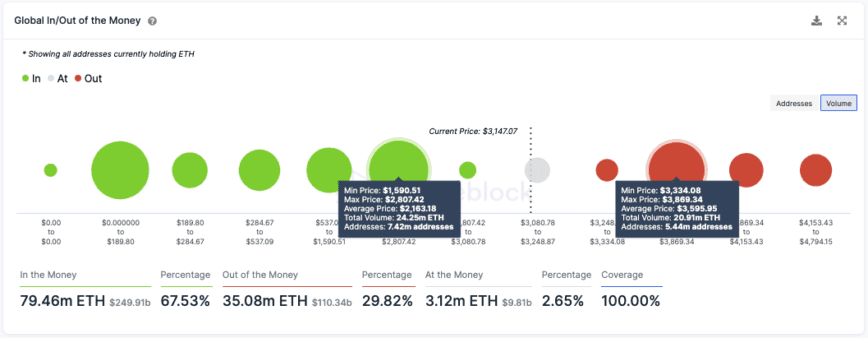
Although Ethereum is sitting on top of weak support, transaction history shows that it only has one obstacle to overcome to resume the uptrend.
More than 5.44 million addresses have acquired approximately 21 million ETH between $3,300 and $3,900. A decisive candlestick close above this resistance barrier could propel ETH towards new all-time highs.

Regardless, investors must pay close attention to the $2,800 support level as any signs of weakness around it could encourage market participants to sell. Under such circumstances, Ethereum could fall to $2,500 or even $2,000.
Disclosure: At the time of writing, the author of this piece owned BTC and ETH.
Share this article
Ethereum Hits Crucial Level After Breaking Below $3,000
Ethereum has started the week in sluggish mode after its price suffered another 7% dip. While many market participants are displaying signs of fear, the number two crypto appears to…
Bitcoin Struggling Against Bearish Momentum
Bitcoin is struggling to find a stable support floor as bears appear to have taken over. Historical price action suggests that BTC must hold above $37,300 to avoid capitulation. Bitcoin…
Web3 – What it is, What it Means, and How We’ll Transition
We are at the dawn of a new era of the internet. Bit by bit, this new digital world, and all that it enables, will slowly become a part of…
