- Bitcoin price shows signs of a bottoming process as it trades around the $42,000 level.
- Ethereum price needs to clear the 200-day SMA at $3,431 to embark on a 15% uptrend.
- Ripple price lacks volatility and has its upside potential capped at $0.826.
Bitcoin price is hovering around a crucial barrier moving sideways, suggesting a massive move could be around the corner. Ethereum is already showing promise of a recovery rally while XRP slacks around. Some altcoins are already swinging higher, showing strength and optimism.
Bitcoin price positions itself for a quick run-up
Bitcoin price has been stuck trading around the $42,000 level for nearly a week. The big crypto could form a bottom after it dips for the third time into the liquidity pool below $41,492. This swing low could trigger an uptrend that penetrates above the support floor mentioned above.
The resulting rally aims to retest the $45,678 resistance barrier after a 10% ascent. In some cases, the run-up could extend to $48,027 or the 200-day Simple Moving Average (SMA) around the same level.
In total, BTC could stand to gain 15% if the aforementioned bullish scenario plays out.
BTC/USD 4-hour chart
While things are looking good for Bitcoin price, a breakdown of the liquidity pool’s lower limit at $39,057 will create a lower low, invalidating the bullish thesis. This development could further crash BTC to $30,000.
Ethereum price prepares for a relief rally
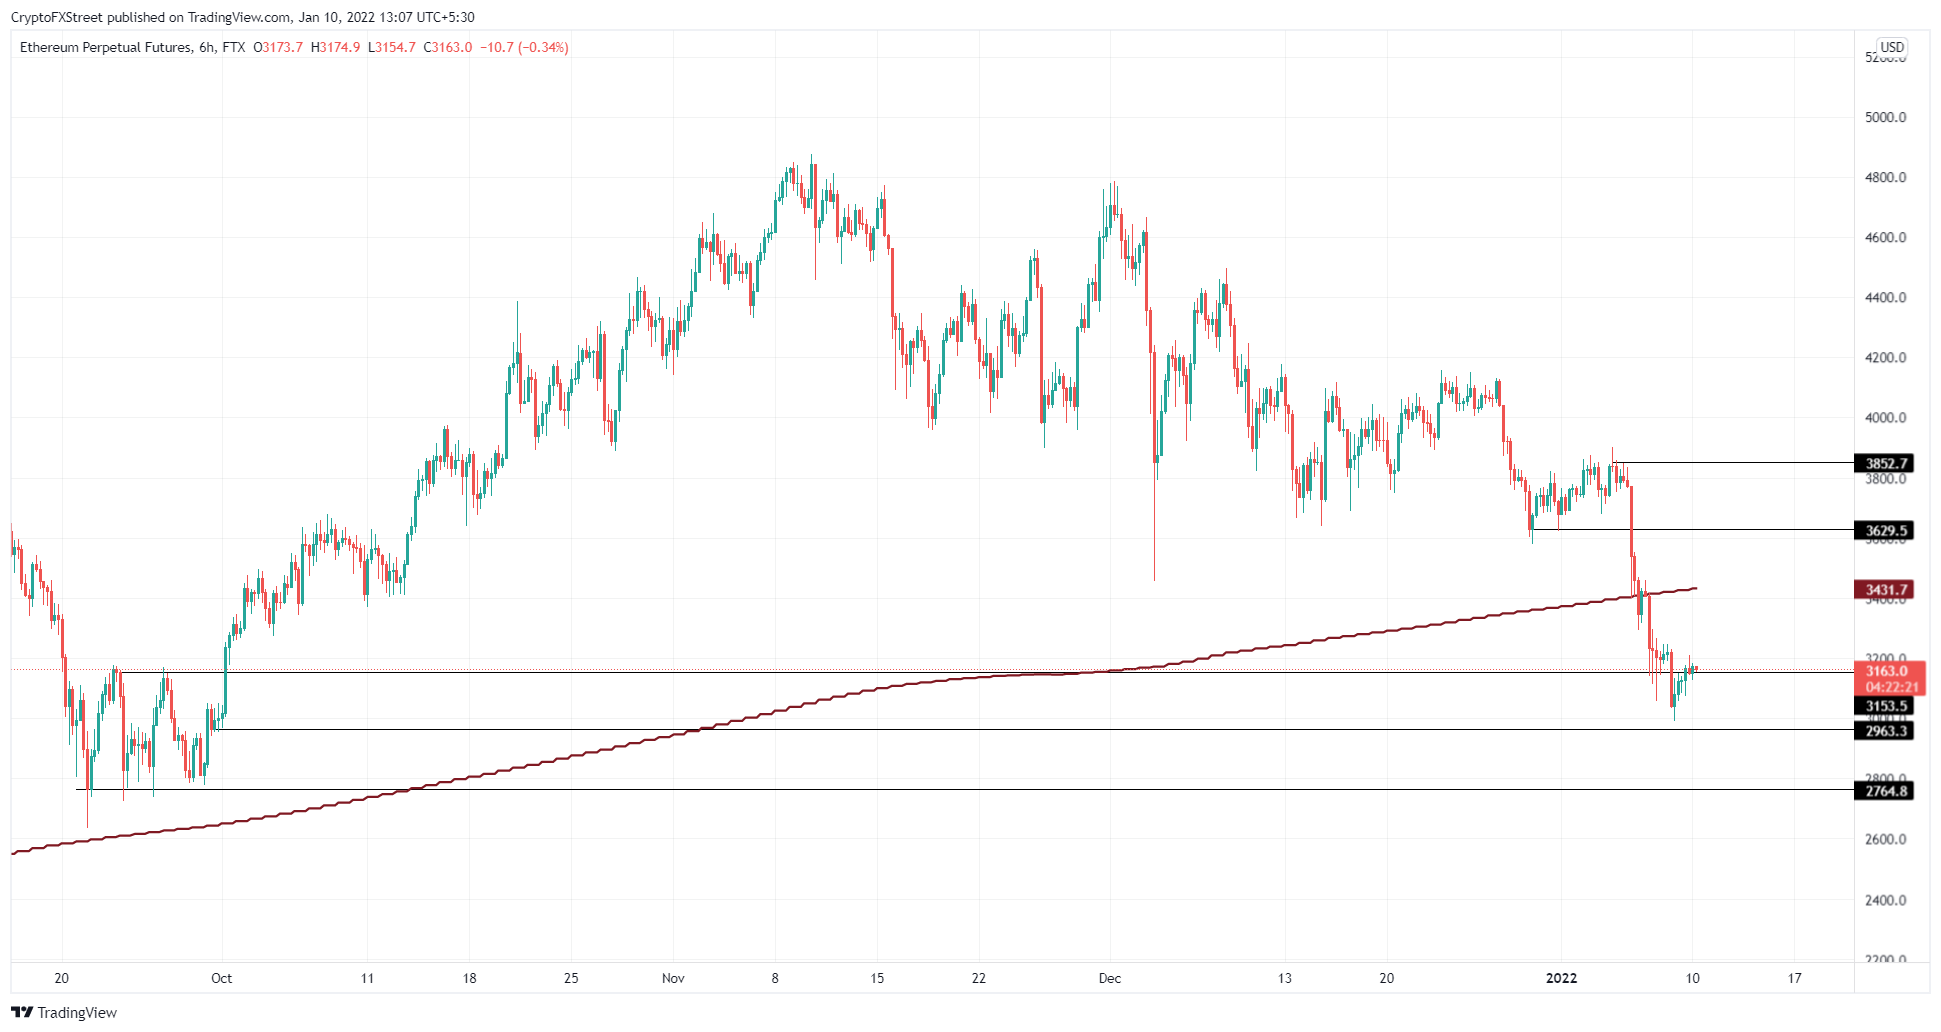
Ethereum price is following Bitcoin’s steps and is currently hovering around the $3,153 barrier. Although ETH has recovered above it, there is a chance it could slice through it to produce another swing low, completing its bottoming process.
This development in ETHis likely to trigger an uptrend to $3,629, constituting a 15% surge, closely following BTC. In some cases, the rally could break through the immediate resistance barrier and make a run for the $3,852 hurdle and the liquidity resting above it. Cumulatively, ETH could see potential gains of 22% if the optimistic scenario plays out.
ETH/USD 6-hour chart
Regardless of the optimism, Ethereum price needs to slice through the 200-day Simple Moving Average (SMA) at $3,431 to fulfill its 22% ascent. A failure to pull through could lead to a 6% crash to the $2,963 support level.
A six-hour candlestick close below this barrier will create a lower low, invalidating the bullish thesis. This swing low could be the origin of a down move that pushes ETH down to $2,764.
Ripple price completes its downside objective
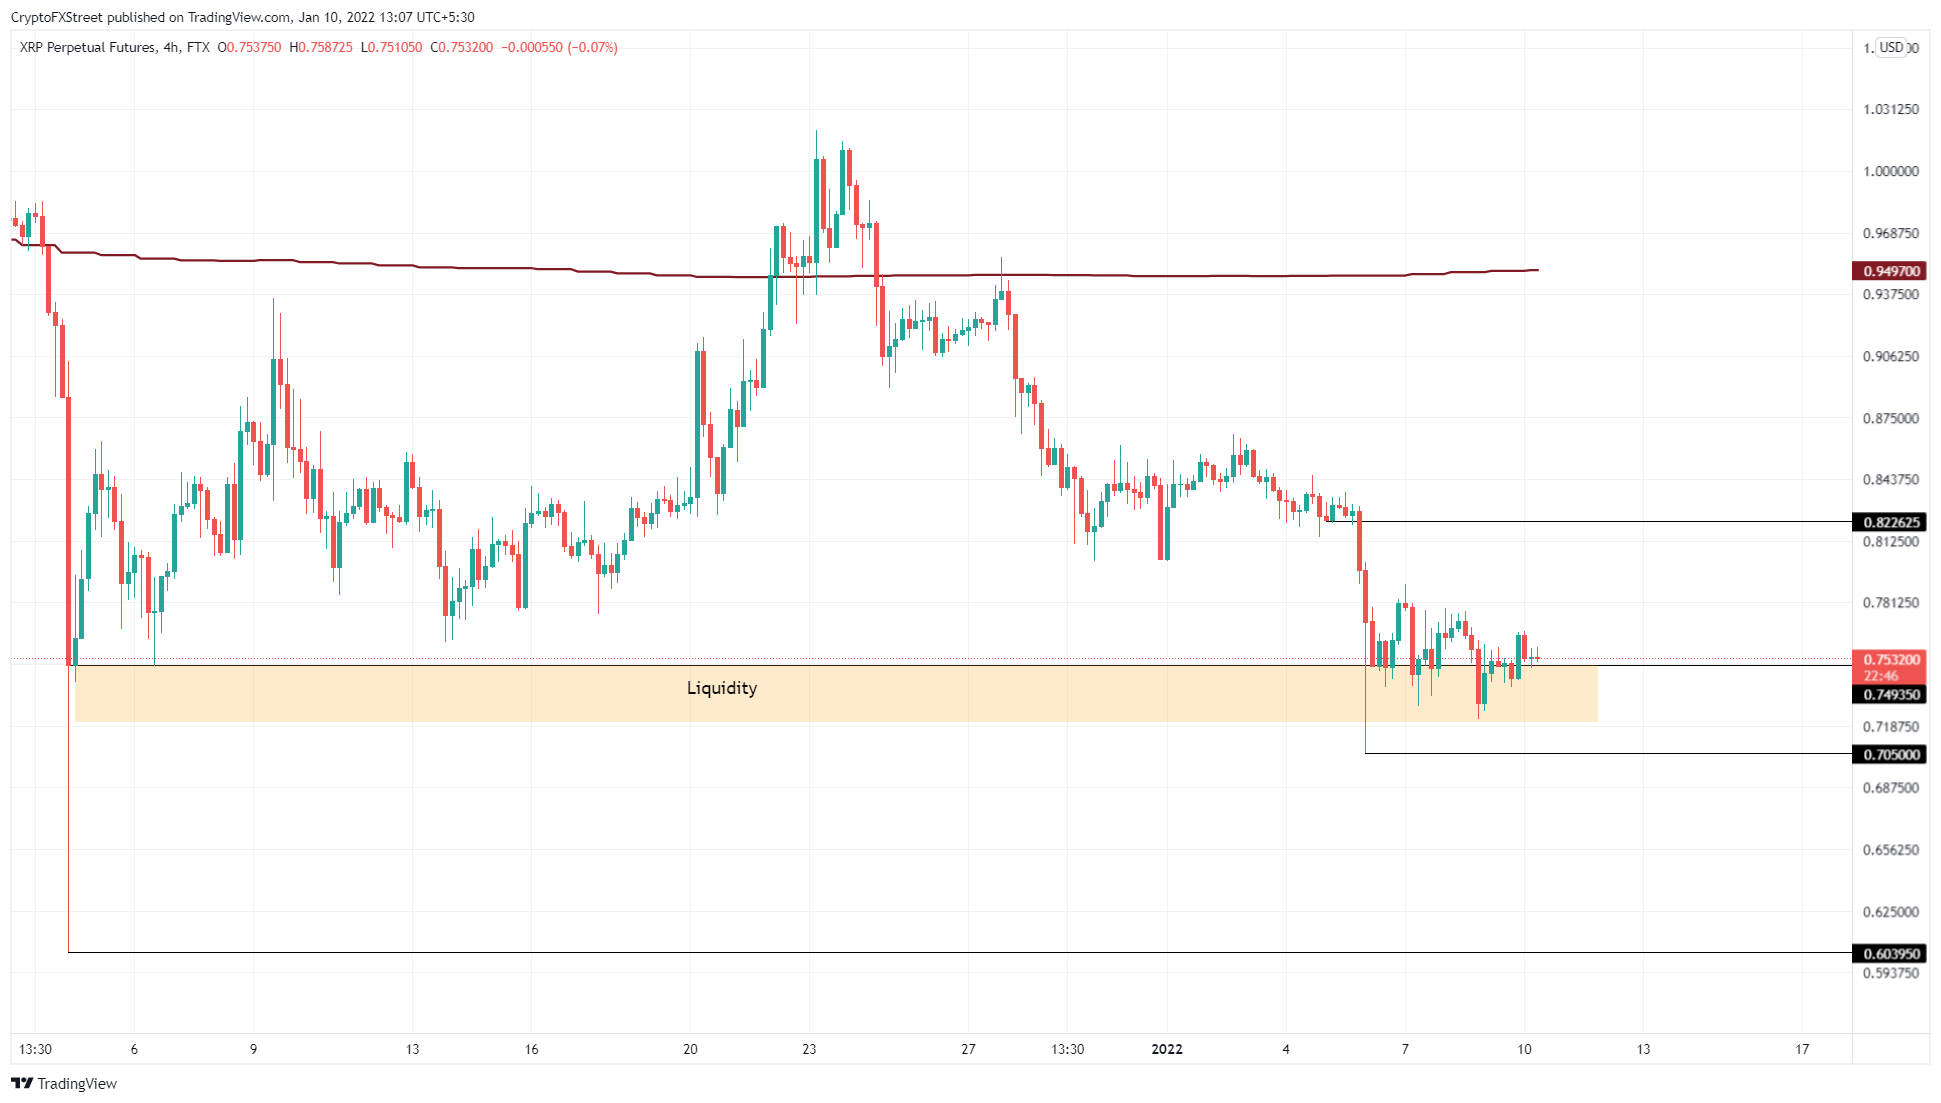
Ripple price collected the liquidity resting below $0.749 from the January 6 flash crash. Since then, the XRP price has been hovering around the same level. This consolidation could be a bottoming pattern before the downtrend attempts a reversal.
Unlike BTC or ETH, XRP price seems to lack volatility, however, and investors should not hold their breath. Expect the uptrend to be capped at $0.823.
XRP/USD 4-hour chart
If the buying pressure fails to push Ripple price higher, there is a higher possibility it will revisit the $0.705 support level. A four-hour candlestick close below this barrier will create a lower low, invalidating the bullish thesis.
Such a development could take XRP price down to $0.604, where the buyers can attempt another uptrend.


