For probably about two years now, it has been generally accepted in the cryptocurrency community that “BTC is an independent asset class,” which demonstrates that the first cryptocurrency performs well as an investment tool that hardly correlates with the economic cycle and is not even associated with other asset classes. On August 18, 2020, CoinShares even released a whole report on this, which mainly talked about the lack of correlation between bitcoin and commodities and traditional stocks.
But what about the correlation with the U.S. Dollar Currency Index (DXY)? Max Keiser was one of the first to draw our attention to bitcoin’s negative correlation with the U.S. dollar. In other words, when the U.S. dollar rises, then, as a rule, BTC tends to fall. I’ll also add that there is rarely a positive correlation between BTC and the U.S. dollar.
Still, if there is a positive correlation, it carries medium- and long-term risks for a stable upward trend in bitcoin.
Examples Of Negative Correlation Between BTC And DXY
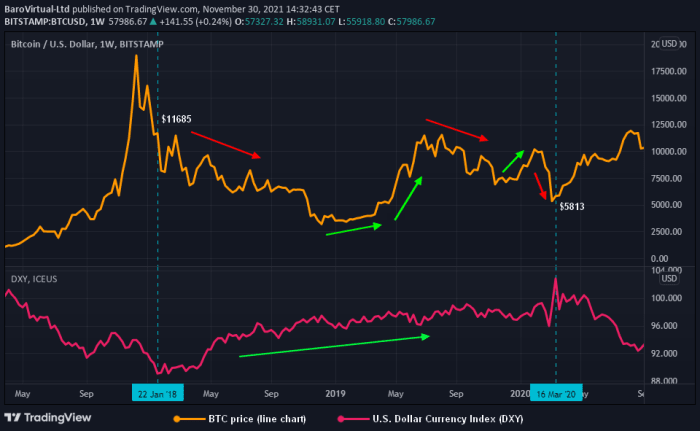
In the chart above, we can see that the downtrend in the U.S. dollar, which began on December 19, 2016, at $103.10, led to a sharp rise in the price of BTC from $890 to $18,953, while the U.S. dollar fell to $89 by January 22, 2018. A similar situation was observed on March 16, 2020, when the U.S. dollar entered a brutal downtrend due to the U.S. financial government institutions’ not-entirely-rational monetary policy.
These two examples perfectly demonstrate the classic inverse correlation approach between bitcoin and the U.S. dollar. These are not the only examples of this statement; you can easily find other earlier examples through a trading charts provider.
Examples Of Positive Correlation Between BTC And DXY
As you can see from the chart above, a positive correlation leads to at least uncertainty and at most wild turbulence, including significant bearish corrections.
In the long term, the perceptible strengthening of the U.S. dollar between January 22, 2018, and March 16, 2020, had a very negative impact on the state of bitcoin. Actually, it seems that the periods marked on the chart were probably some of the worst milestones in bitcoin history, comparable to the first “crypto winter” of 2013 to 2015, as retail investors suffered colossal losses in the first place, just like other groups of traders.
Now, understanding from historical examples that the correlation between bitcoin and DXY exists, it is clear that this correlation really should be seriously monitored. Let’s move on to the factors behind the current strengthening of the U.S. dollar, which carries medium- and long-term risks to the outlook of bitcoin’s price cycle.
The Current State Of Bitcoin And DXY
First, let’s look at the technical picture of the correlation of the considered assets and determine what type of correlation is observed right now.
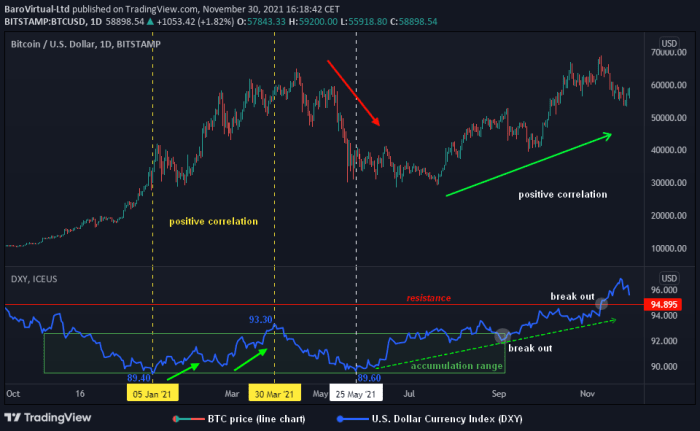
The chart above shows the second positive correlation between the U.S. dollar and bitcoin this year, which carries many risks for bitcoin.
From May 25 of this year, the U.S. dollar began a steady upward trend within the framework of a kind of accumulated consolidation from November 6, 2020, to September 3, 2021. Within the framework of this consolidation, there was also the first local positive correlation, which led to the collapse of bitcoin to the general negative signs of an impending correction on April 14, 2021. Also, the U.S. dollar has successfully overcome the resistance at $94.895 and has successfully consolidated above it, i.e., the DXY is still bullish.
Three key factors support the bullishness of the U.S. dollar, but with the potential to harm bitcoin for the foreseeable future:
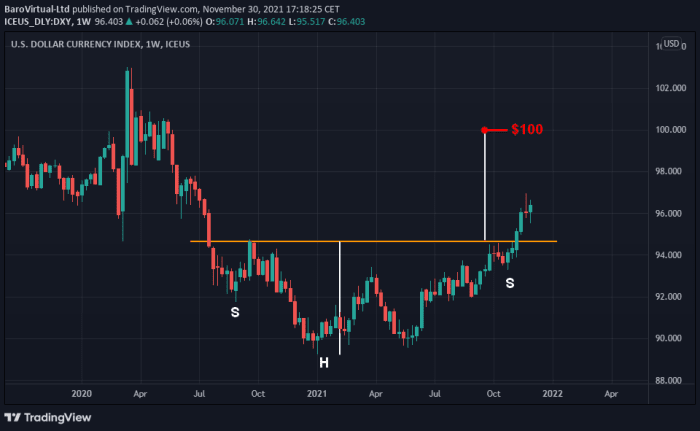
1. Bullish formation on the DXY weekly chart:
The successful implementation of this pattern can bring very unpleasant surprises to bitcoin, as professional investors will weaken their positions in all risky assets, of course, which is also BTC. A successful breakout of the $100 mark will lead to a more severe reduction in long positions in bitcoin and its derivatives, including traditional stocks tools on BTC.
2. The number of transactions of foreign participants with the U.S. dollar:
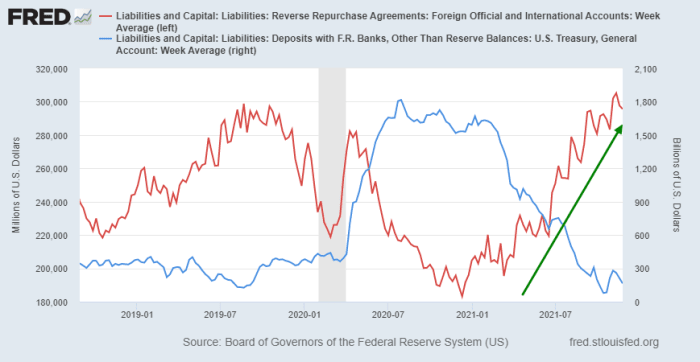
Foreign official deals with U.S. dollar. Source: FRED.
Daily repurchase agreements (REPOs) for non-residents (brown line) has an upward trend, suggesting that the U.S. dollar is still demanded. I think that this is the main factor supporting the bullish sentiment of the U.S. dollar right now.
3. The state of dollar liquidity in the international market:
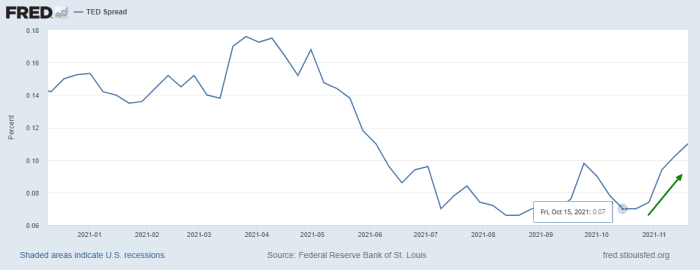
TED spread. Source: FRED.
The TED spread reflects the demand for dollar liquidity in the global market in London, U.K. (LIBOR).
As you can see in the local size, starting from October 15, 2021, this indicator is growing, which indicates a steady demand for the dollar from foreign players, who are now profitable in maintaining the strengthening of the U.S. dollar. This mood prevails among foreign participants, including because the Federal Reserve, following a meeting on November 3, 2021, reduced the quantitative easing (QE) program, which, among other things, harms bitcoin in the medium- and long-term perspective.
I would also like to draw your attention to the fact that a new strain of COVID-19 may disrupt the Fed’s plans to slow down the “printing press.” Since a specific part of the growth of the U.S. dollar was based, among other things, on the expectations that the Fed will accelerate the pace of the stimulus program winding down, such negative news may cause particular uncertainty to form.
To summarize, it should be said that I wouldn’t want you to get the impression that the method we reviewed works 100% and without failures. I want to convey to the community that the historical data of a particular asset and the methods for comparing them is still of great value. In this regard, we have to monitor the correlation between bitcoin and the U.S. dollar, since this allows us to build a kind of defensive response system to protect our investment (trading) positions.
This is a guest post by Virtual Baro. Opinions expressed are entirely their own and do not necessarily reflect those of BTC Inc or Bitcoin Magazine.

