
- Bitcoin price makes a strong comeback after rallying 9% over the past 48 hours.
- Ethereum price struts toward $5,000 after a brief bounce from the $4,380 support level.
- Ripple price rallies 11% with hopes of flipping the $1.31 to $1.41 supply zone.
Bitcoin price has been on a steady uptrend for the past two days and shows signs of continuing. Ethereum and Ripple are following the big cryptic and are heading higher. This trend is likely to translate to other altcoins in the market soon.
Bitcoin price and volatility resurface
Bitcoin price was stuck consolidating under the $63,757 resistance barrier and the $60,000 support level for roughly 16 days. However, the sudden uptick in buying pressure on November 8 has propelled BTC by 4% so far.
If this ascent continues, allowing the Bitcoin price to produce a daily close above $65,000, it will confirm the start of an uptrend. In such a situation, BTC will make a run at the $70,000 psychological barrier and set a new high here.
BTC/USD 1-day chart
If Bitcoin price fails to break above the $65,000 barrier, it will likely slide into consolidation. A daily close below $60,000 will invalidate the bullish thesis and knock BTC down to the liquidity area ranging from $52,956 to $56,004.
Ethereum price makes its way up
Ethereum price has been on a slow but unwavering uptrend since October 1. The recent slowdown in Bitcoin price action did not stop ETH as it set up a new record high at $4,460. The replenished bullish momentum in BTC seems to be rippling out to ETH as it is currently in the price discovery phase with a new all-time high at $4,768.
If the bullish outlook persists, there is a high chance ETH will tag the $5,000 psychological level and make a run for the next level at $6,384.
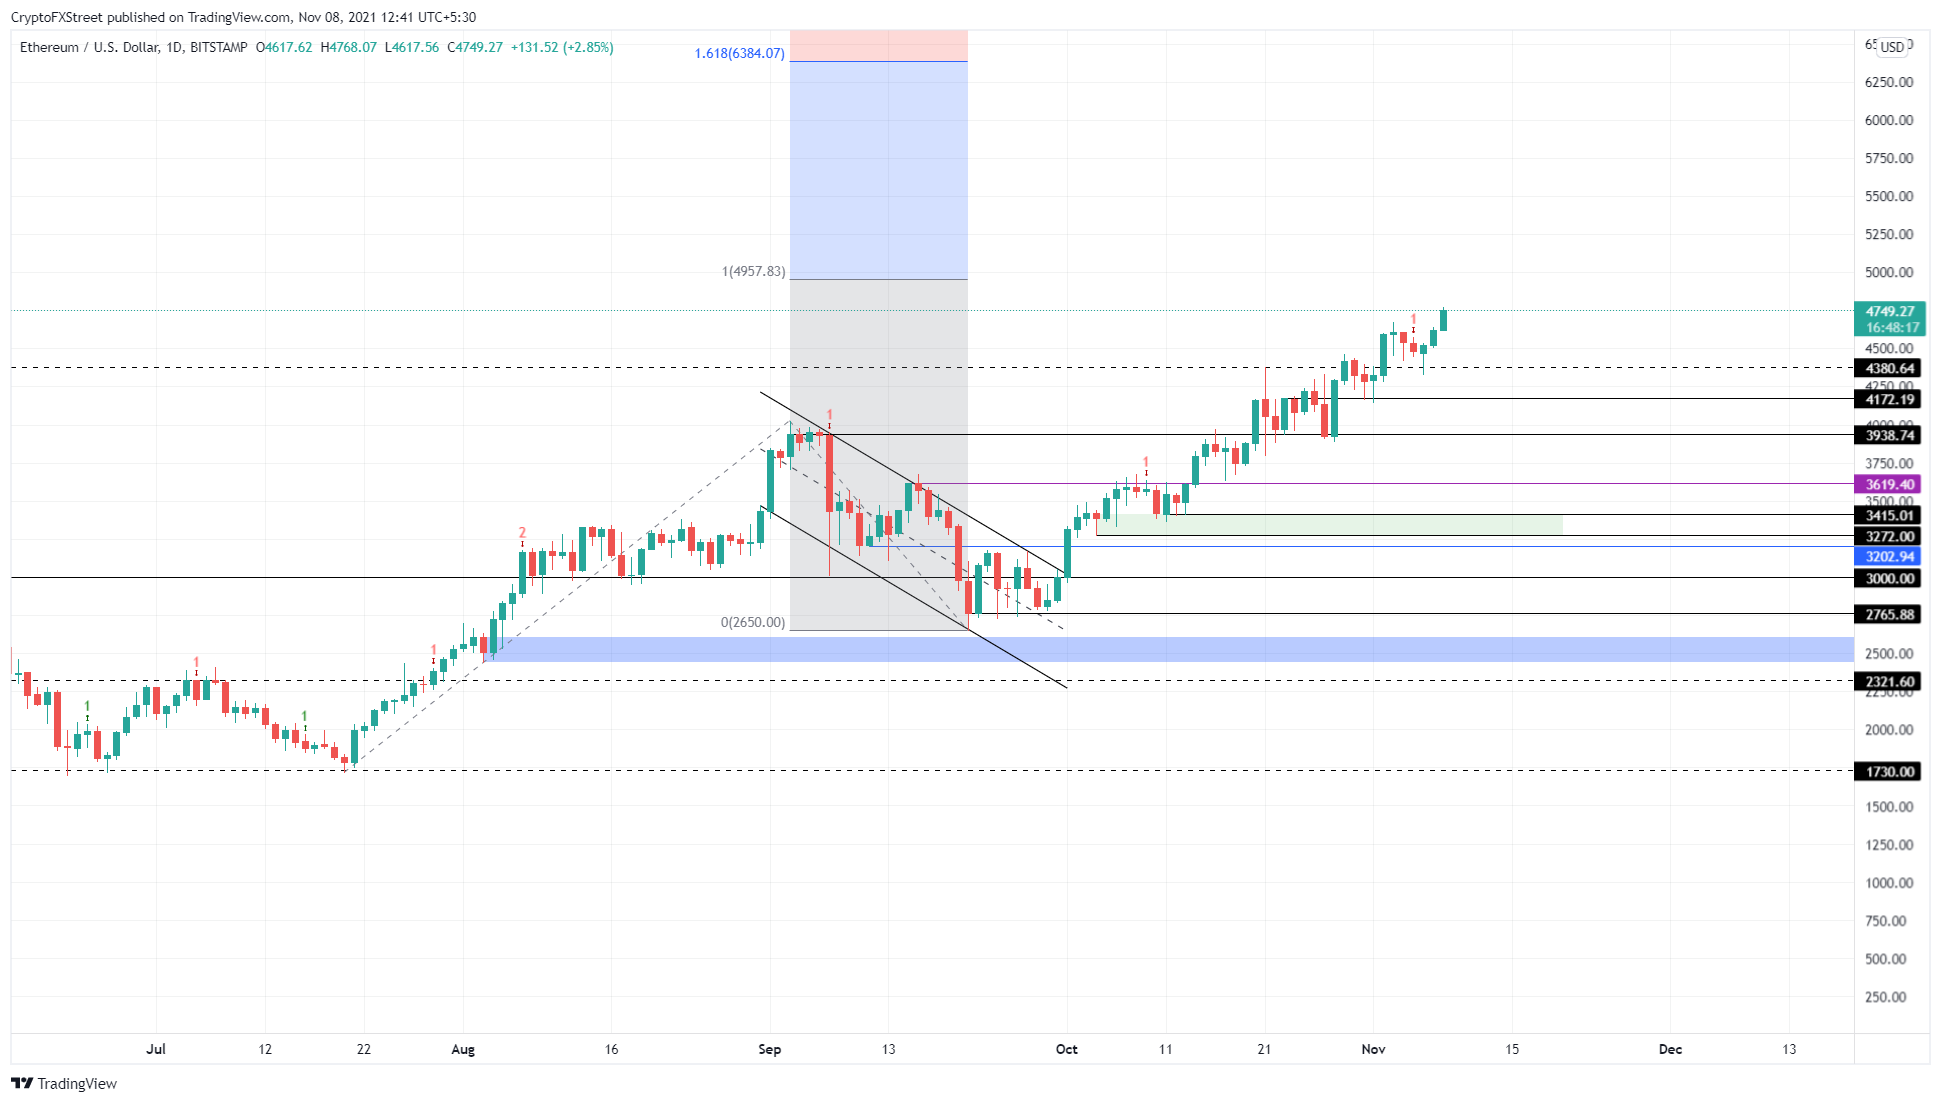
ETH/USD 1-day chart
Regardless of the bullish outlook, if Bitcoin price crashes to $51,000, investors can expect Ethereum price to respond by retracing to $4,000 or $3,600 support floor.
Ripple price looks ready to tackle hurdles
Ripple price set up multiple lower highs and three higher lows from August 9. Connecting these swing points using trend lines reveals the formation of a symmetrical triangle. This technical formation forecasts a 79% ascent to $1.97, determined by adding the distance between the first swing high and low to the breakout point at $1.1.
XRP price breached the pattern’s upper trend line on November 2 and has rallied 19% so far. A continuation of the upswing will put Ripple in front of the supply zone that extends from $1.31 to $1.41.
A daily close above this level will suggest the continuation of the uptrend to roughly $2.
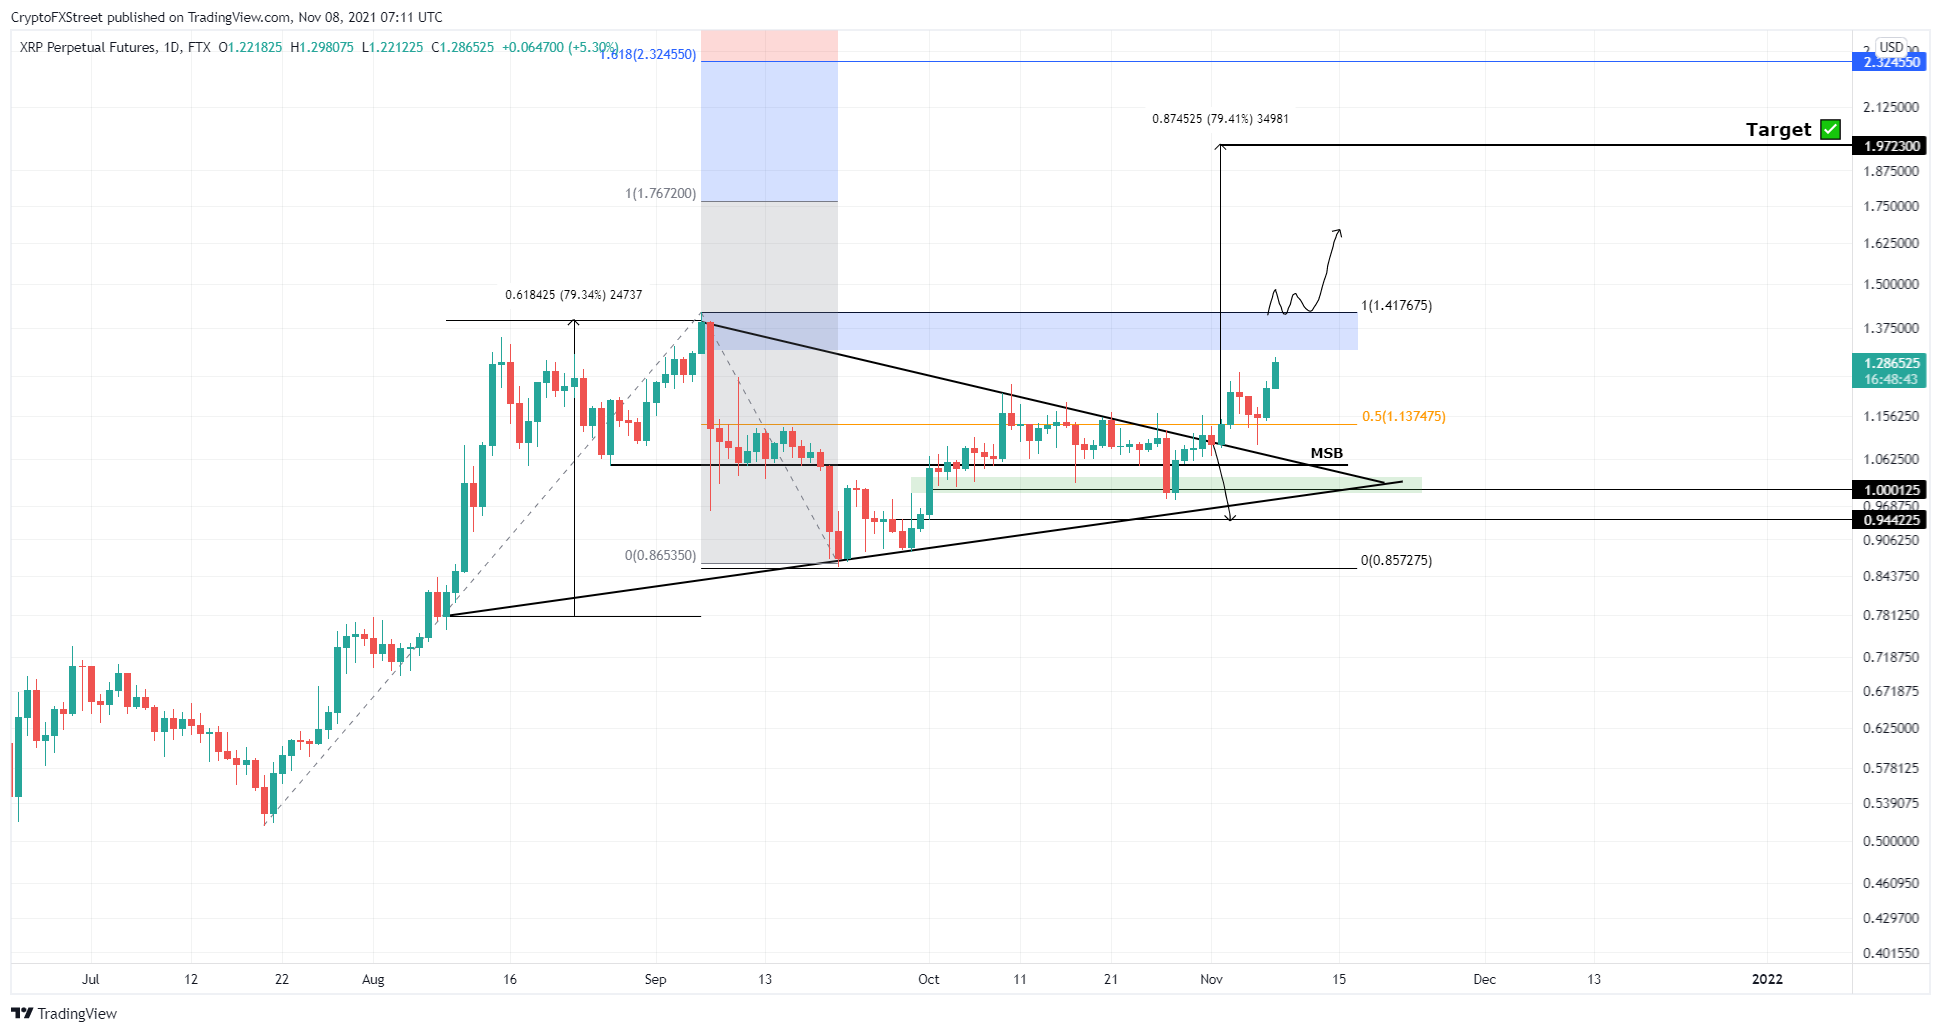
XRP/USD 1-day chart
On the other hand, if Ripple price fails to breach the said supply zone, investors should expect a pullback to the 50% Fibonacci retracement level at $1.13. A breakdown of this barrier will jeopardize the upswing and open the possibility of a retest of the $1.05 support level.