- Bitcoin price rose 13% in the first three days of October, igniting a bullish market outlook.
- Ethereum price followed BTC’s footsteps and broke out of a descending parallel channel, climbing 18%.
- Ripple price flipped the $1.01 resistance barrier into a stable support floor.
Bitcoin price was under a lot of pressure as it squeezed during its descent. BTC broke out of the falling wedge pattern on October 1 in an explosive manner, taking altcoins for a ride.
Bitcoin price prepares to launch
Bitcoin price rose 13% from October 1 to October 3. While this ascent was impressive, its goal was to collect liquidity resting above the September 18 swing high at $48,834. On October 3, BTC reached its destination, which signifies that the bellwether crypto is primed for a correction.
Further adding credence to this outlook is the Momentum Reversal Indicator (MRI)’s red ‘one’ sell signal. This technical formation forecasts a one-to-four candlestick correction.
Therefore, investors can expect BTC to head to the immediate and stable support platform at approximately $45,000.
A resurgence of the buying pressure around this level is the key to setting higher highs and restarting the bull run. A decisive close above $53,000 would indicate the reversal of the move to $29,000 and an attempt to retest the next psychological level at $60,000.
BTC/USD 12-hour chart
Investors are cautiously optimistic, because the bullish thesis assumes that there will be a resurgence of buyers around $45,000. If the selling pressure overwhelms the bulls, it is highly likely Bitcoin price will revisit $42,900.
A breach below $40,000 will invalidate the bullish thesis and potentially trigger a drop to $36,276.
Ethereum price fails to sustain
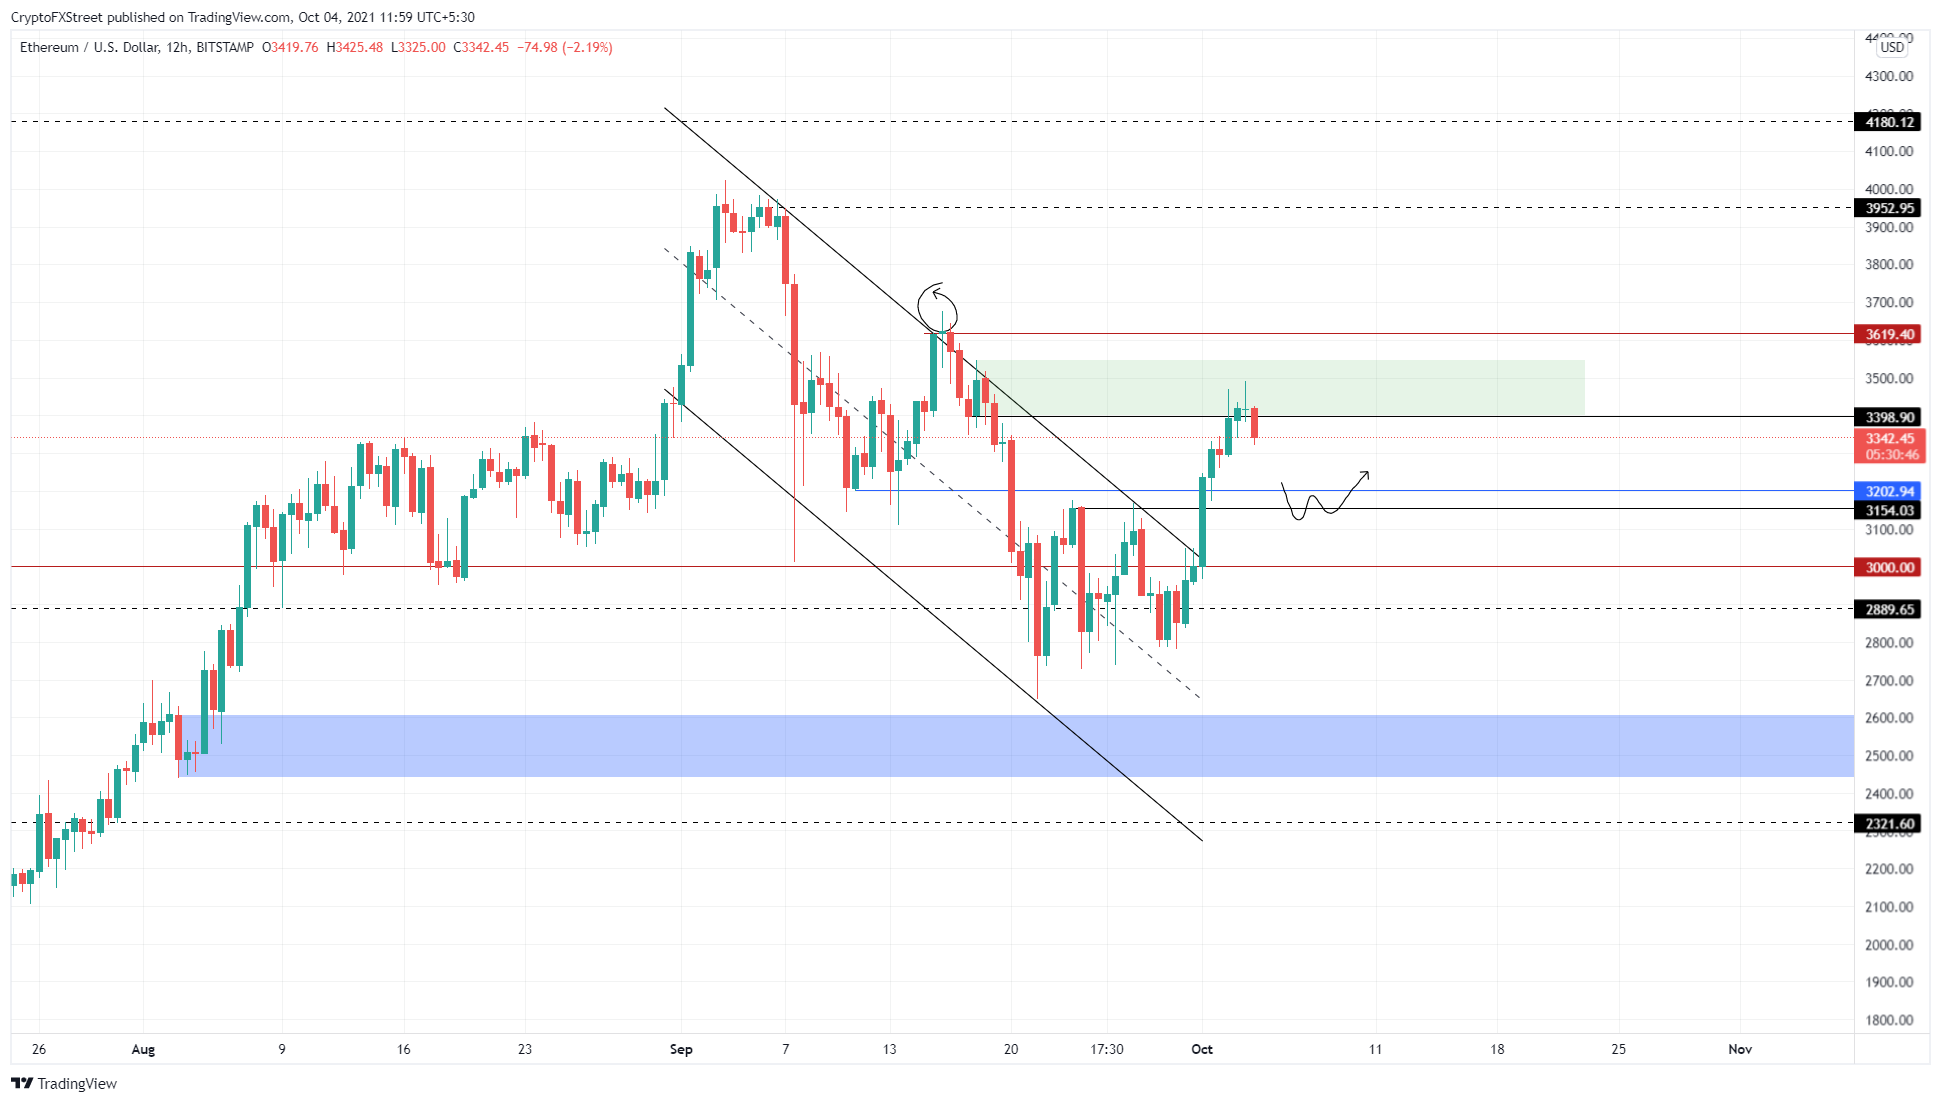
Ethereum price breached its descending parallel channel on October 1 as the big crypto enjoyed a breakout. However, ETH is currently facing a blockade after it failed to pierce the 12-hour demand zone ranging from $3,400 to $3,545.
Rejection from this level is likely to push Ethereum price to $3,202 or $3,154. Moreover, the bearish outlook on BTC further helps this corrective wave that is expected on ETH.
In some cases, ETH might retest the $3,000 support floor before starting a new impulsive wave that slices through the said demand zone and reaches the $4,000 psychological level.
ETH/USD 12-hour chart
Regardless of the bearish outlook on Ethereum price, if the buyers band together now, pushing ETH past the upper limit of the demand zone at $3,545, it will invalidate the bullish thesis and indicate that investors are not booking profits.
This development might then allow ETH bulls to target the $4,000 psychological level.
Ripple price buyers and sellers in agreement
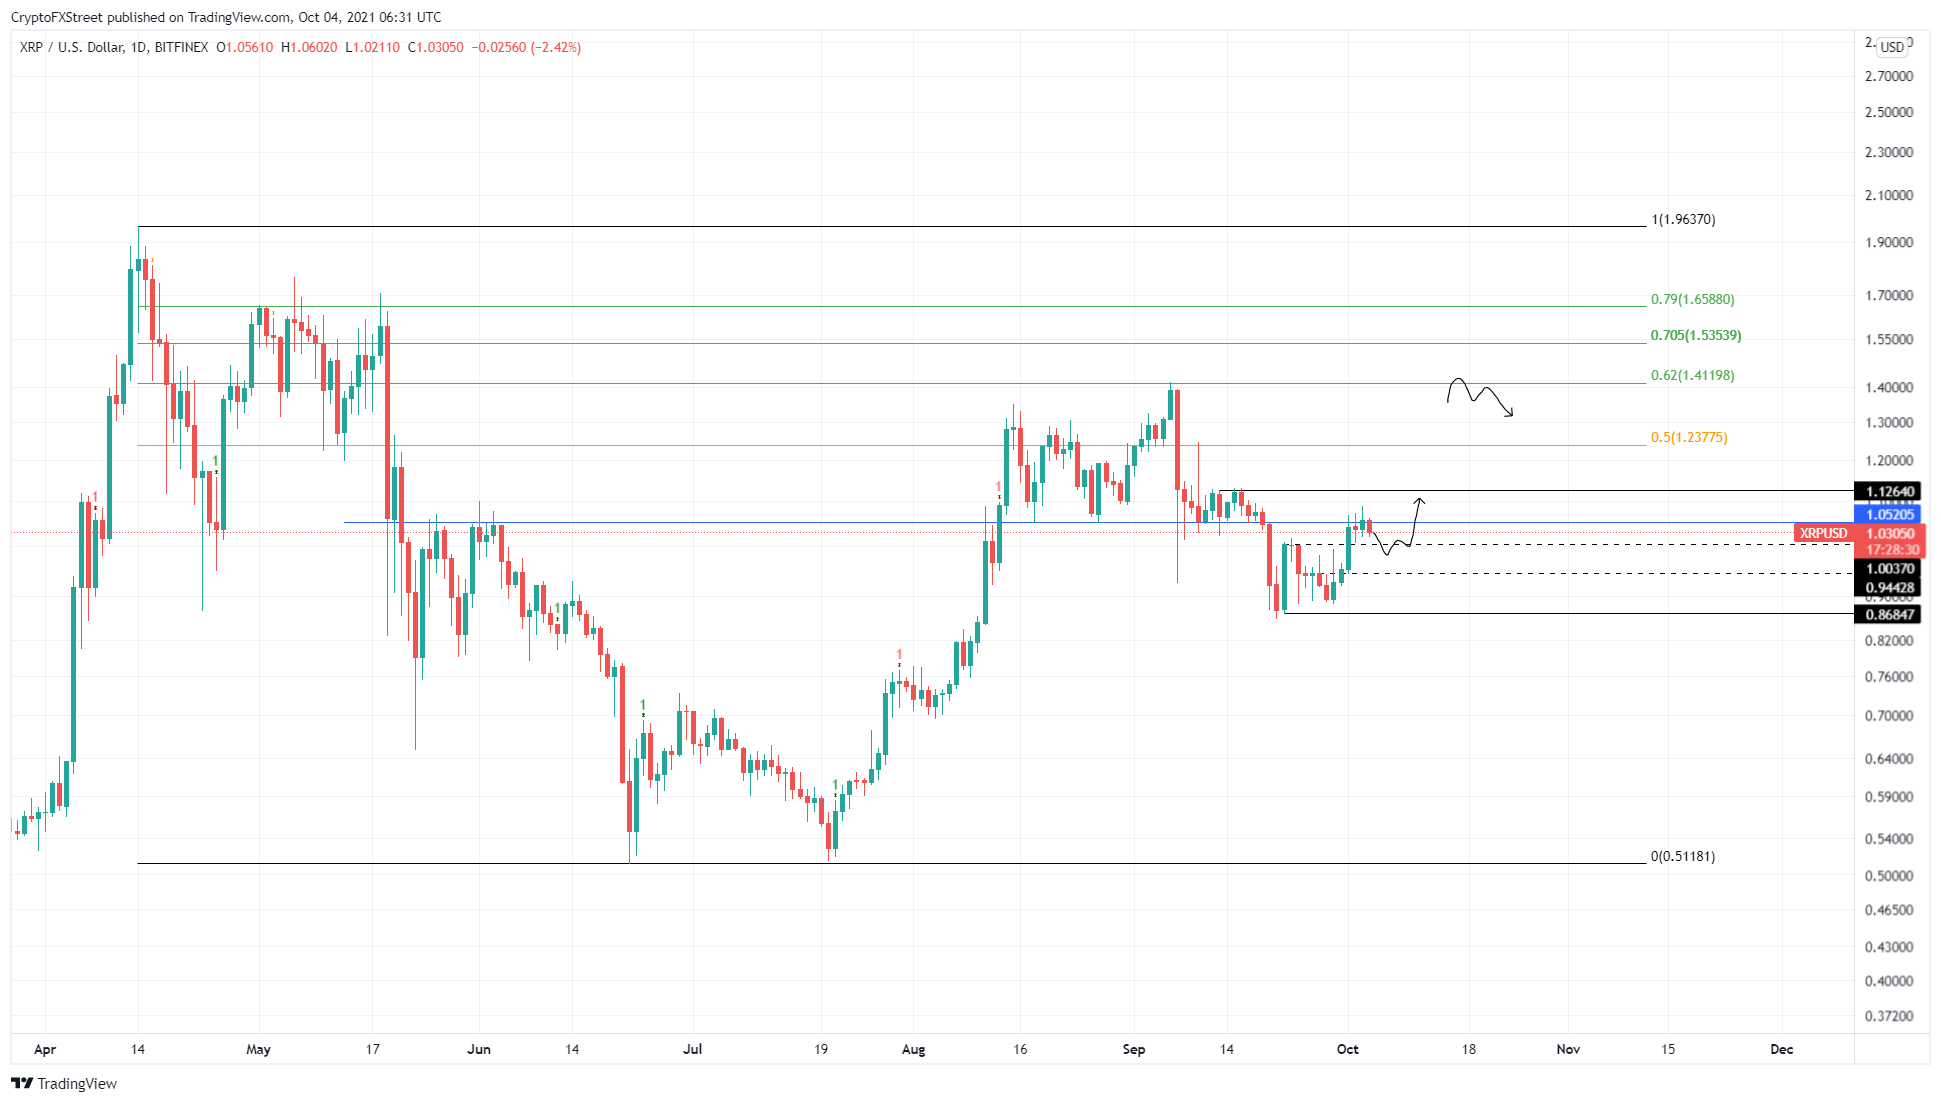
After days of struggle, Ripple (XRP) price broke through the $1 barrier in October after a 9.3% ascent. Unlike other altcoins, XRP price seems to be facing a lack of volatility, which has led to a sideways movement just below the $1.05 resistance barrier.
This slow development indicates that the buyers are more or less in agreement with sellers. A breakout from this coiling is likely to propel the remittance token higher. However, if XRP price manages to produce a decisive close above $1.12, it could mark a 35% ascent to $1.53, coinciding with the 70.5% Fibonacci retracement level.
XRP/USD 1-day chart
While things are going slow for Ripple price, a breakdown of the $1 foothold will put the buyers in trouble. This development could knock XRP price down to the support floors at $0.94 or $0.87.
However, a decisive close below $0.87 will invalidate the bullish thesis and potentially lower the market value of the remittance token.


