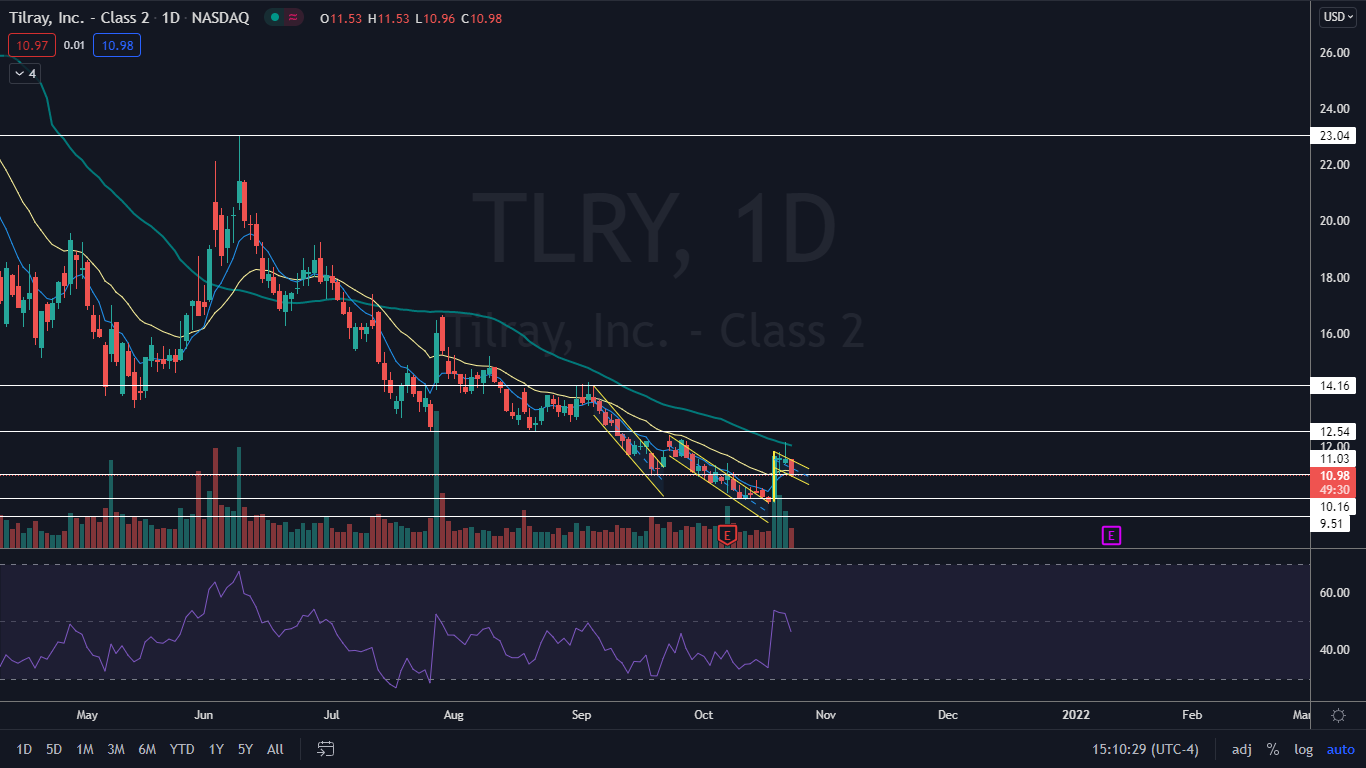
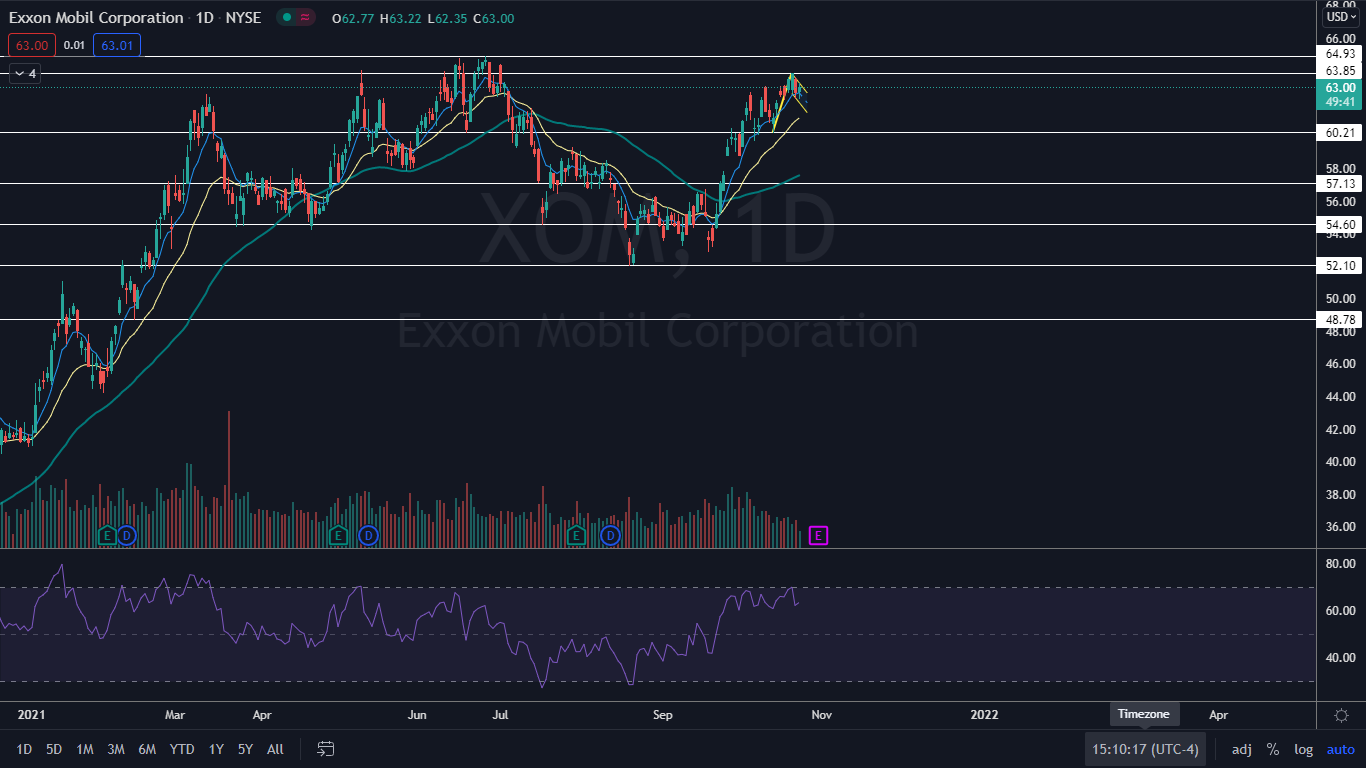
Coinbase Global, Inc (NASDAQ: COIN), Tilray, Inc (NASDAQ: TLRY) and Exxon Mobil Corporation (NYSE: XOM) have all settled into bullish flag patterns on the daily chart. The bull flag pattern is created with a sharp rise higher forming the pole, which is then followed by a consolidation pattern that brings the stock lower between a channel with parallel lines.
- For bearish traders, the “trend is your friend” (until it’s not) and the stock may continue downwards within the following channel for a short period of time. Aggressive traders may decide to short the stock at the upper trendline and exit the trade at the lower trendline.
- Bullish traders will want to watch for a break up from the upper descending trendline of the flag formation, on high volume, for an entry. When a stock breaks up from a bull flag pattern, the measured move higher is equal to the length of the pole and should be added to the lowest price within the flag.
A bull flag is negated when a stock closes a trading day below the lower trendline of the flag pattern or if the flag falls more than 50% down the length of the pole.
See Also: Coinbase Giving Away A $135,000 Bored Ape: Here Are The Details
The Coinbase Chart: Coinbase broke up from a lower bull flag pattern on Oct. 14 and soared 26% higher to an Oct. 20 high of $317.37. On Thursday, the stock began to consolidate the move higher, which continued into Friday’s trading session. The rise paired with the fall has settled Coinbase into a bull flag pattern on the daily chart.
The consolidation into the flag has also helped to drop the stock’s relative strength index (RSI), which had reached over 77%. Bulls can watch for an upwards break from the downward trending flag pattern on high volume.
The Tilray Chart: Big bullish volume entered Tilray’s chart on Oct. 19 and the stock soared up about 16% higher, which created the pole of the bull flag pattern. Since the date, Tilray has been consolidating the move, which has formed the flag of the pattern. On Oct. 21, Tilray attempted to break up bullishly from the flag but rejected the 50-day simple moving average and fell back into the pattern.
Like with Coinbase, bullish traders can watch for a break up from the pattern on high volume.

The Exxon Chart: Exxon reversed course into an uptrend on Sept. 20 and has made a series of consistent higher highs and higher lows on the daily chart. Between Oct. 13 and Oct. 20 the stock soared up 6% higher, which created the pole of the bull flag and the consolidation since has created the flag.
Like Coinbase, Exxon needs the consolidation within the flag to lower its RSI, which has now dropped from 70% to 60%.

Want direct analysis? Find me in the BZ Pro lounge! Click here for a free trial.
© 2021 Benzinga.com. Benzinga does not provide investment advice. All rights reserved.
