
XRP/USD – XRP Establishes Narrow Range
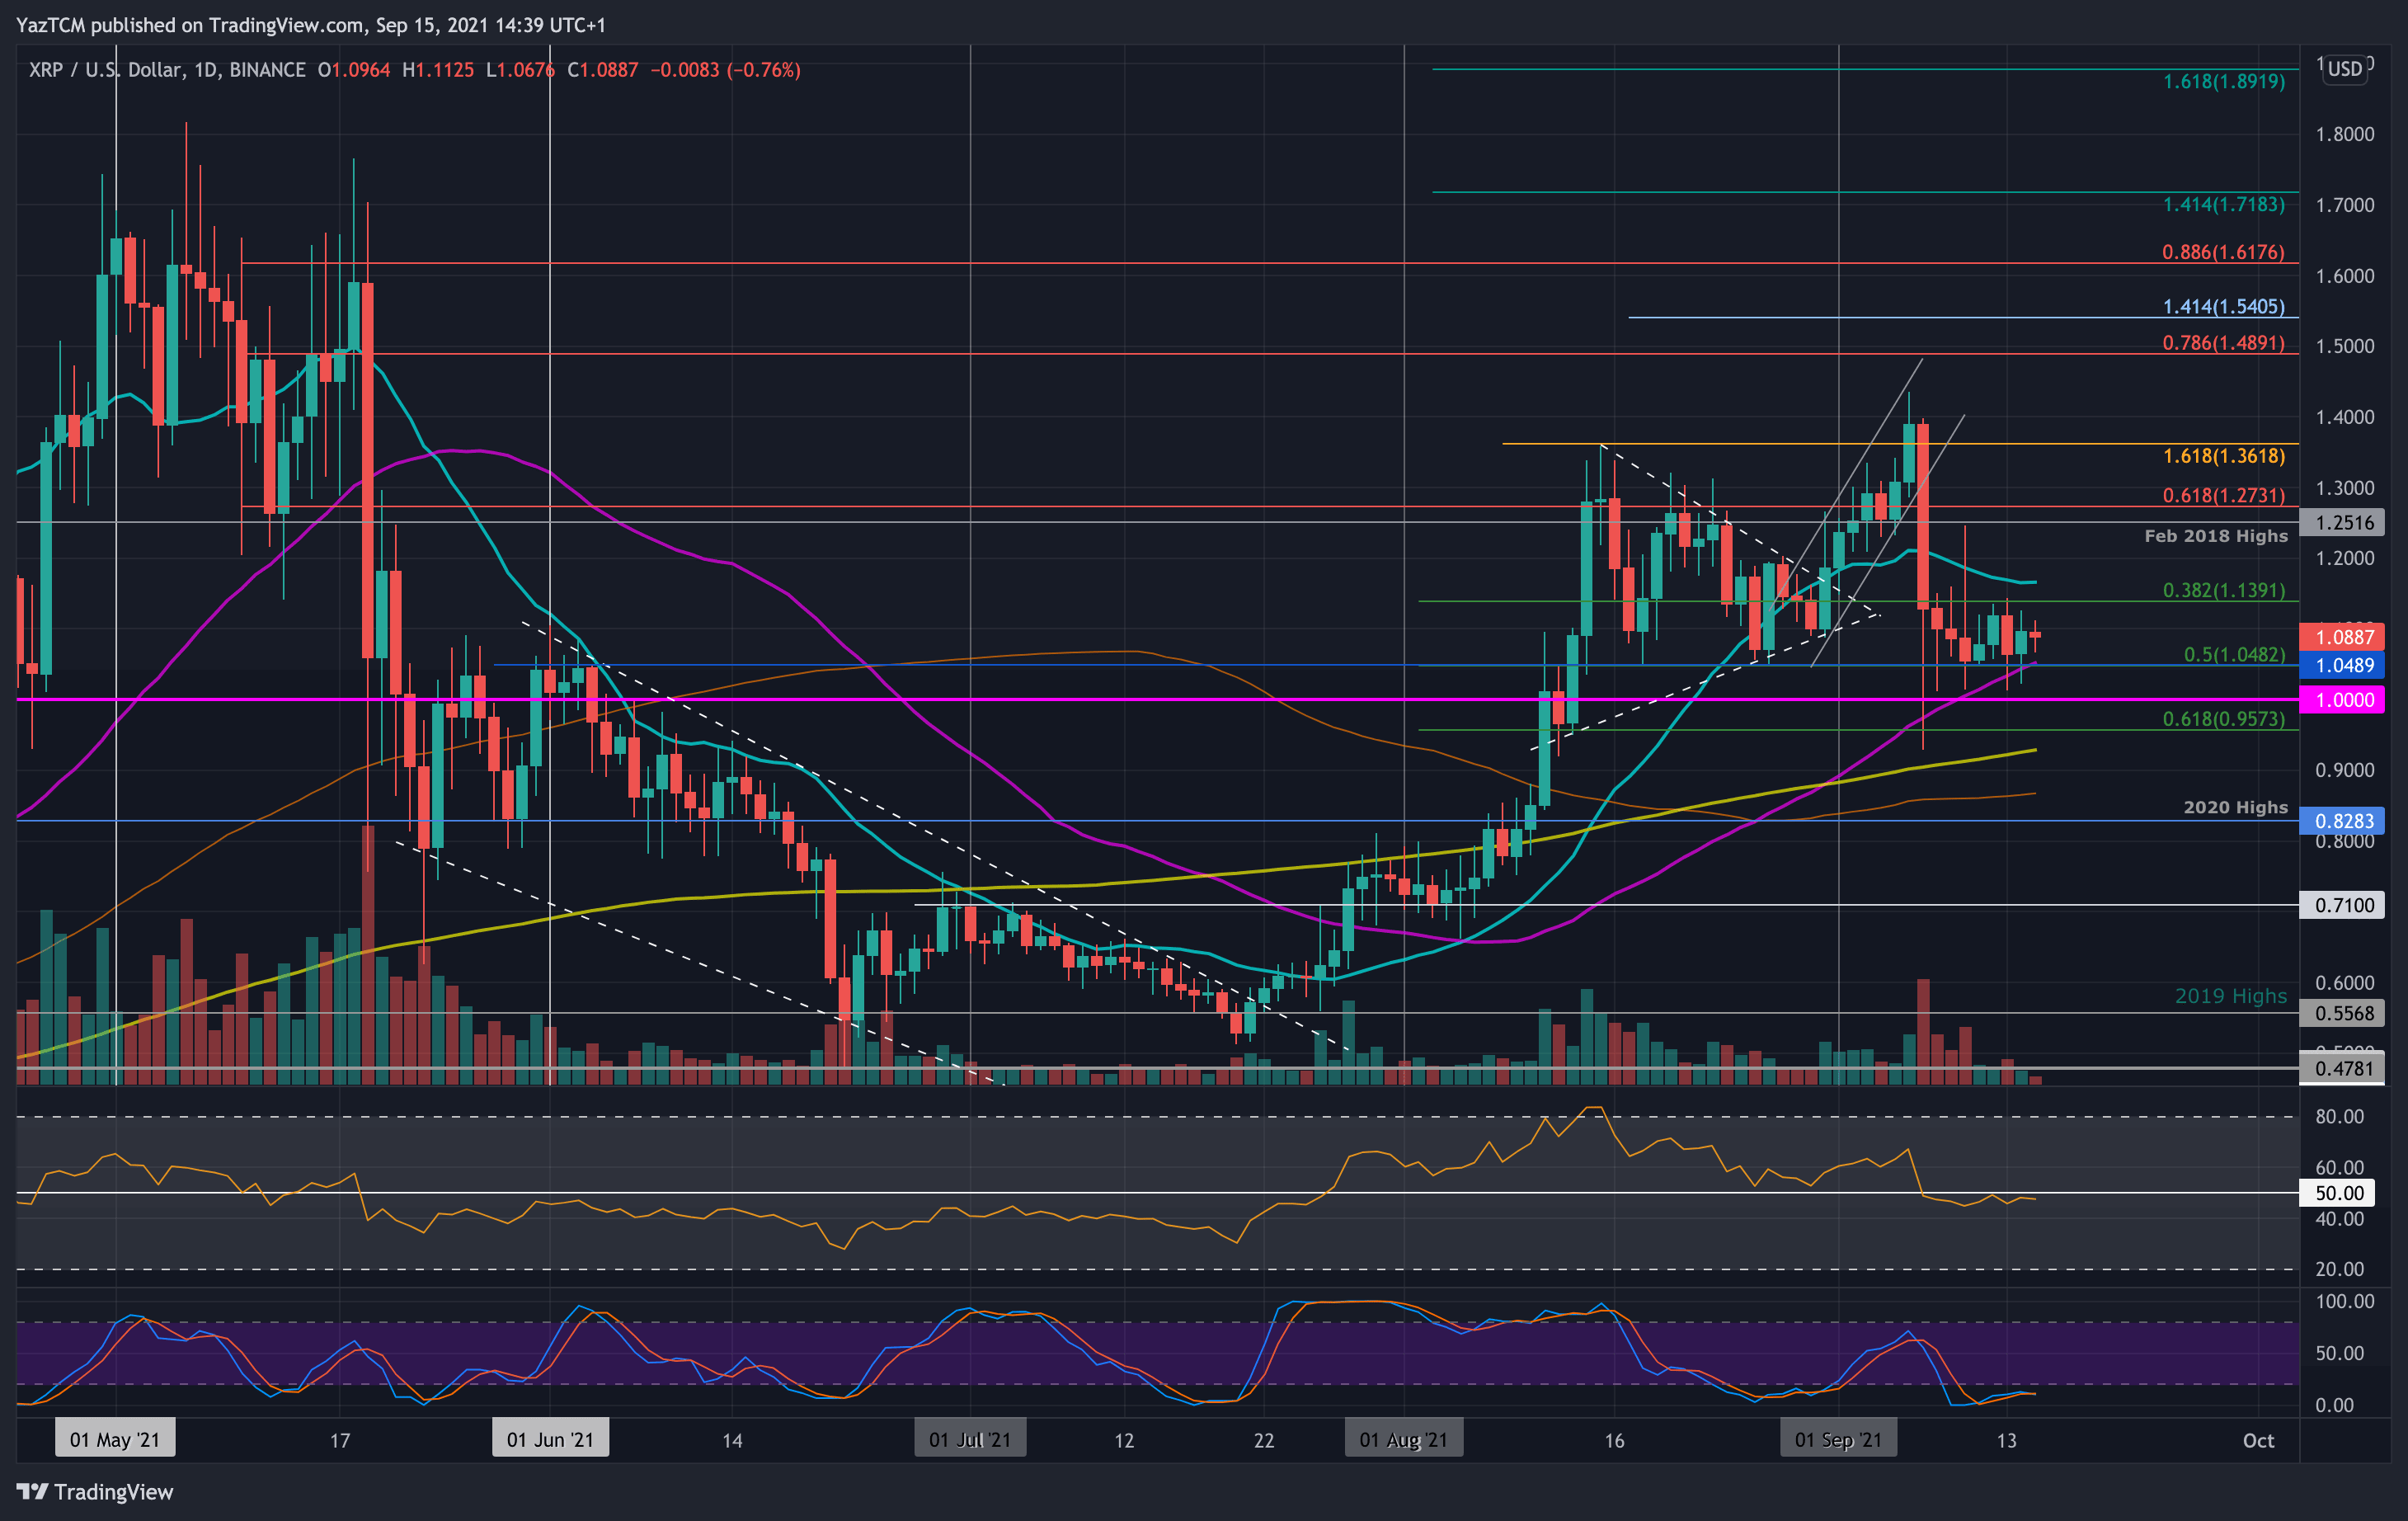
Key Support Levels: $1.05, $1.00, $0.95.
Key Resistance Levels: $1.14, $1.17, $1.25.
Since crashing from $1.40 last Tuesday, XRP has established a range between $1.05 and $1.14 over the past week. The support at $1.05 is provided by a .5 Fib and is now bolstered by the 50-day MA.
The cryptocurrency has dropped numerous times beneath $1.05 but has managed to close each daily candle above that line. On the other side, the resistance at $1.14 provided support in August and will need to be overcome in order to end the current range.
XRP-USD Short Term Price Prediction
Looking ahead, the first support lies at $1.05 (.5 Fib & 50-day MA). The next levels are at $1.00, $0.95 (.618 Fib), $0.92 (200-day MA), and $0.86 (100-day MA).
On the other side, the first resistance lies at $1.14. This is followed by $1.17 (20-day MA), $1.25 (Feb 2018 highs), and $1.36 (1.618 Fib Extension & August highs).
The RSI is marginally below the midline, indicating the previous bullish momentum has completely faded. For a chance to break above the current range, the RSI must rise above the midline to indicate bullish momentum within the market.
XRP/BTC – Bulls Battle to Defend the 50-day MA
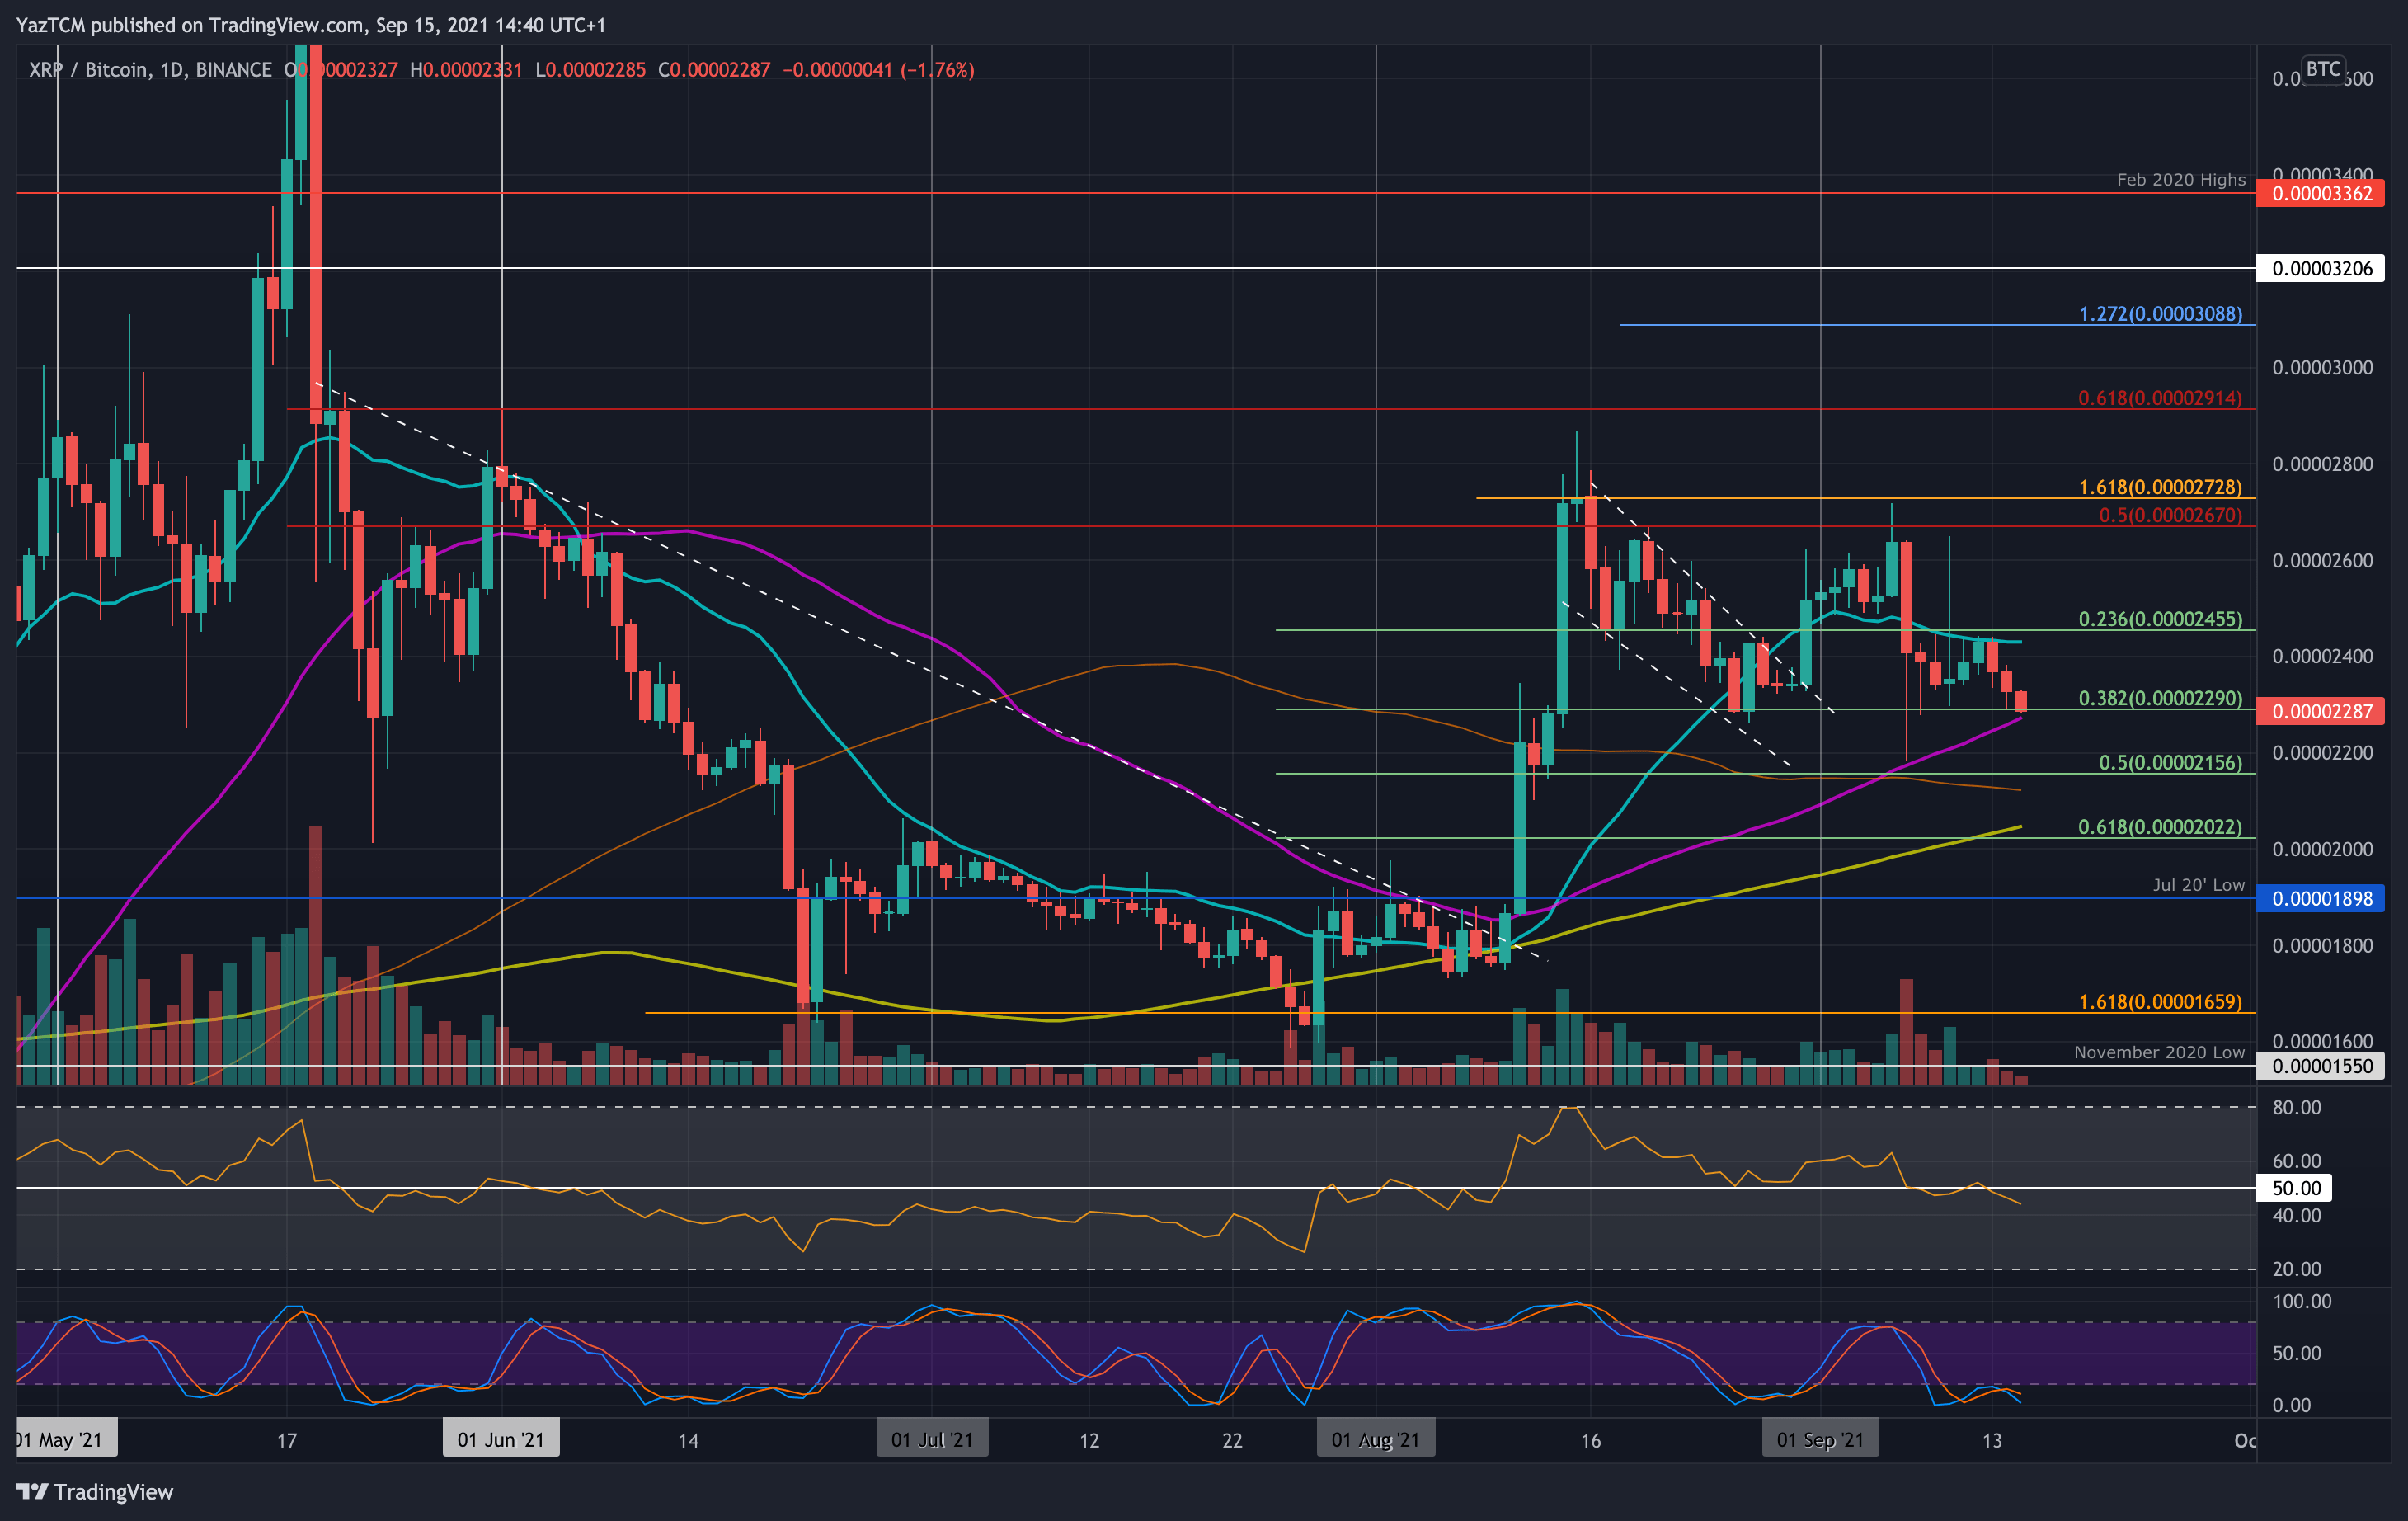
Key Support Levels: 2290 SAT, 2200 SAT, 2000 SAT.
Key Resistance Levels: 2430 SAT, 2600 SAT, 2800 SAT.
XRP is also trading lower against BTC as the bulls will have to try to defend the 50-day MA support around 2290 SAT. The altcoin could not break resistance at 2670 SAT (bearish .5 Fib) last week and ended up collapsing to 2400 SAT during the Tuesday market-wide crash.
Since then, XRP has slowly headed lower until finding the support at the 50-day MA level today.
XRP-BTC Short Term Price Prediction
Looking ahead, the first support lies at 2290 SAT (.382 Fib & 50-day MA). The next ones are at 2200 SAT (.5 Fib & 100-day MA), 2000 SAT (.618 Fib & 200-day MA), and 1900 SAT (July 2020 low).
Looking from the opposite direction, the first resistance lies at 2430 SAT (20-day MA). If conquered, the ones that follow are at 2600 SAT, 2670 SAT (bearish .5 Fib), 2800 SAT, and 2915 SAT (bearish .618 Fib).
Likewise, the RSI is beneath the midline, indicating increasing bearish momentum. If it continues to head lower, the rising bearish pressure is likely to cause XRP to fall beneath the 50-day MA against BTC.
Binance Futures 50 USDT FREE Voucher: Use this link to register & get 10% off fees and 50 USDT when trading 500 USDT (limited offer).
PrimeXBT Special Offer: Use this link to register & enter POTATO50 code to get 50% free bonus on any deposit up to 1 BTC.
Disclaimer: Information found on CryptoPotato is those of writers quoted. It does not represent the opinions of CryptoPotato on whether to buy, sell, or hold any investments. You are advised to conduct your own research before making any investment decisions. Use provided information at your own risk. See Disclaimer for more information.
Cryptocurrency charts by TradingView.