Bitcoin (BTC/USD), Ethereum (ETH/USD), Solana (SOL/USD) Price, Chart, and Analysis
- Solana soars on heavy volume.
- Bitcoin remains in a holding pattern for now.
- Ethereum prints a fresh multi-month high.
The cryptocurrency market is nudging higher with the market’s capitalization back above $2.10 trillion, driven in part by a strong performance across the alt-coin space. Solana (SOL) has been a notable out-performer over the recent weeks, hitting a high of $130 on Monday before fading back to a current level of $110. Solana, now the 8th largest crypto by market cap, traded around $22 in late July and started the year around $2. The recent rally has been accompanied by surging volumes, suggesting further highs may be on the horizon.
Solana (SOL) Continues to Make Fresh Highs on Pumped Up Volume
Solana (SOL/USD) Daily Price Chart September 1, 2021
Chart via Trading View
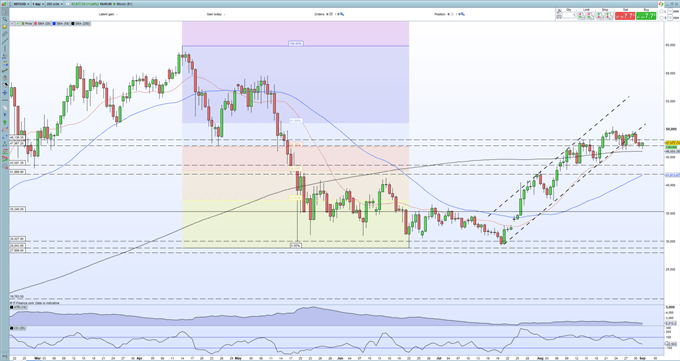
The recent Bitcoin consolidation phase looks set to continue as the market leader’s dominance is gradually eaten into by a resurgent Ethereum. The current range between $46.3k and $50.5k looks set to hold in the short-term with support being underpinned by 200-day sma, currently at $46,050, while the 50% Fibonacci retracement at just under $47k is also helping to pare losses. A break back above the 20-day sma, currently at $47,700, and a return into the recent bullish channel will open the way for BTC to test higher levels.
Bitcoin, Ethereum Predictions – Consolidation Phase Leading to Higher Prices
Bitcoin (BTC/USD) Daily Price Chart September 1, 2021
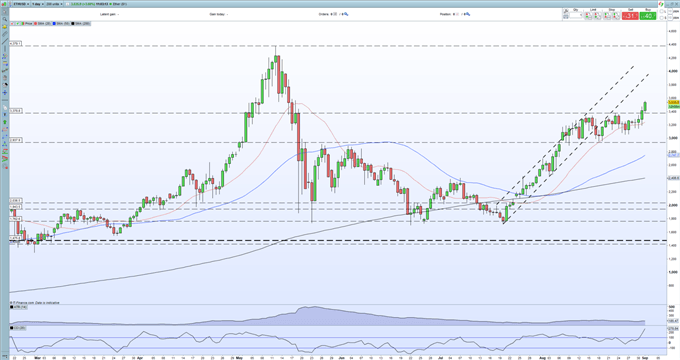
After trading around $3,050 at the end of last week, Ethereum has pushed ever higher and is now at its highest level in over three months. The shorter-dated simple moving average has acted as support for the move, helping ETH break the $3,378 August 23 high with relative ease. As with Bitcoin, the recent bullish channel needs to be regained to allow a fresh attempt at an all-time high. The CCI is showing Ethereum is at extremely overbought levels so this needs to be factored in before making any trading decision.
Ethereum (ETH/USD) Daily Price Chart September 1, 2021
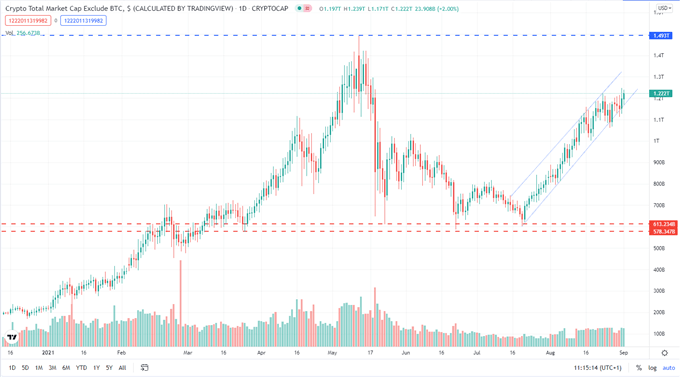
The alt-coin market capitalization is also at fresh multi-month highs, helped by price inflation and new coins entering into the space. The basic uptrend channel on the chart below highlights the growth of the market which is likely to test the mid-May peak at just below $1.5 trillion.
Cryptocurrency Market Minus Bitcoin September 1, 2021
Chart via Trading View
What is your view on Bitcoin, Ethereum, and the Alt-Coin market – bullish or bearish?? You can let us know via the form at the end of this piece or you can contact the author via Twitter @nickcawley1.


