- Bitcoin price closes above the August 1 swing high at $42,599, indicating the end of descent for now.
- Ethereum price shows signs of life after a close above $3,011 support floor but is not in the clear area yet.
- Ripple price needs to climb above the $1.01 demand barrier to enter the safe zone.
Bitcoin price suffered a brutal setback as it dropped from being extremely close to a crucial psychological level to slicing through a stable support floor. Despite the sudden downtick, BTC bulls have stepped in and kick-started what seems to be a recovery.
Bitcoin price awaits confirmation of a new uptrend
Bitcoin price dipped into the demand zone, ranging from $38,207 to $42,206 on September 21, but the resurgence of buying pressure pushed it back. At the time of writing, BTC is trading well above the upper limit of the said support area.
A further increase in bid orders will likely push the pioneer cryptocurrency to the $44,705 resistance level. Breaching this barrier will open the path to a critical supply ceiling at $46,833. While this area will be tough to overcome, doing so will open the way to the $50,000 psychological level.
BTC/USDT 1-day chart
Regardless of the recovery seen over the past 10 hours, if BTC fails to produce a daily close above $42,206, it will indicate a weakness among the bidders. In this case, market participants can expect Bitcoin price to consolidate within the demand zone, ranging from $38,207 to $42,206.
However, a breakdown of $38,207 will invalidate the bullish thesis and potentially trigger a steep descent.
Ethereum price tries to enter the safe zone
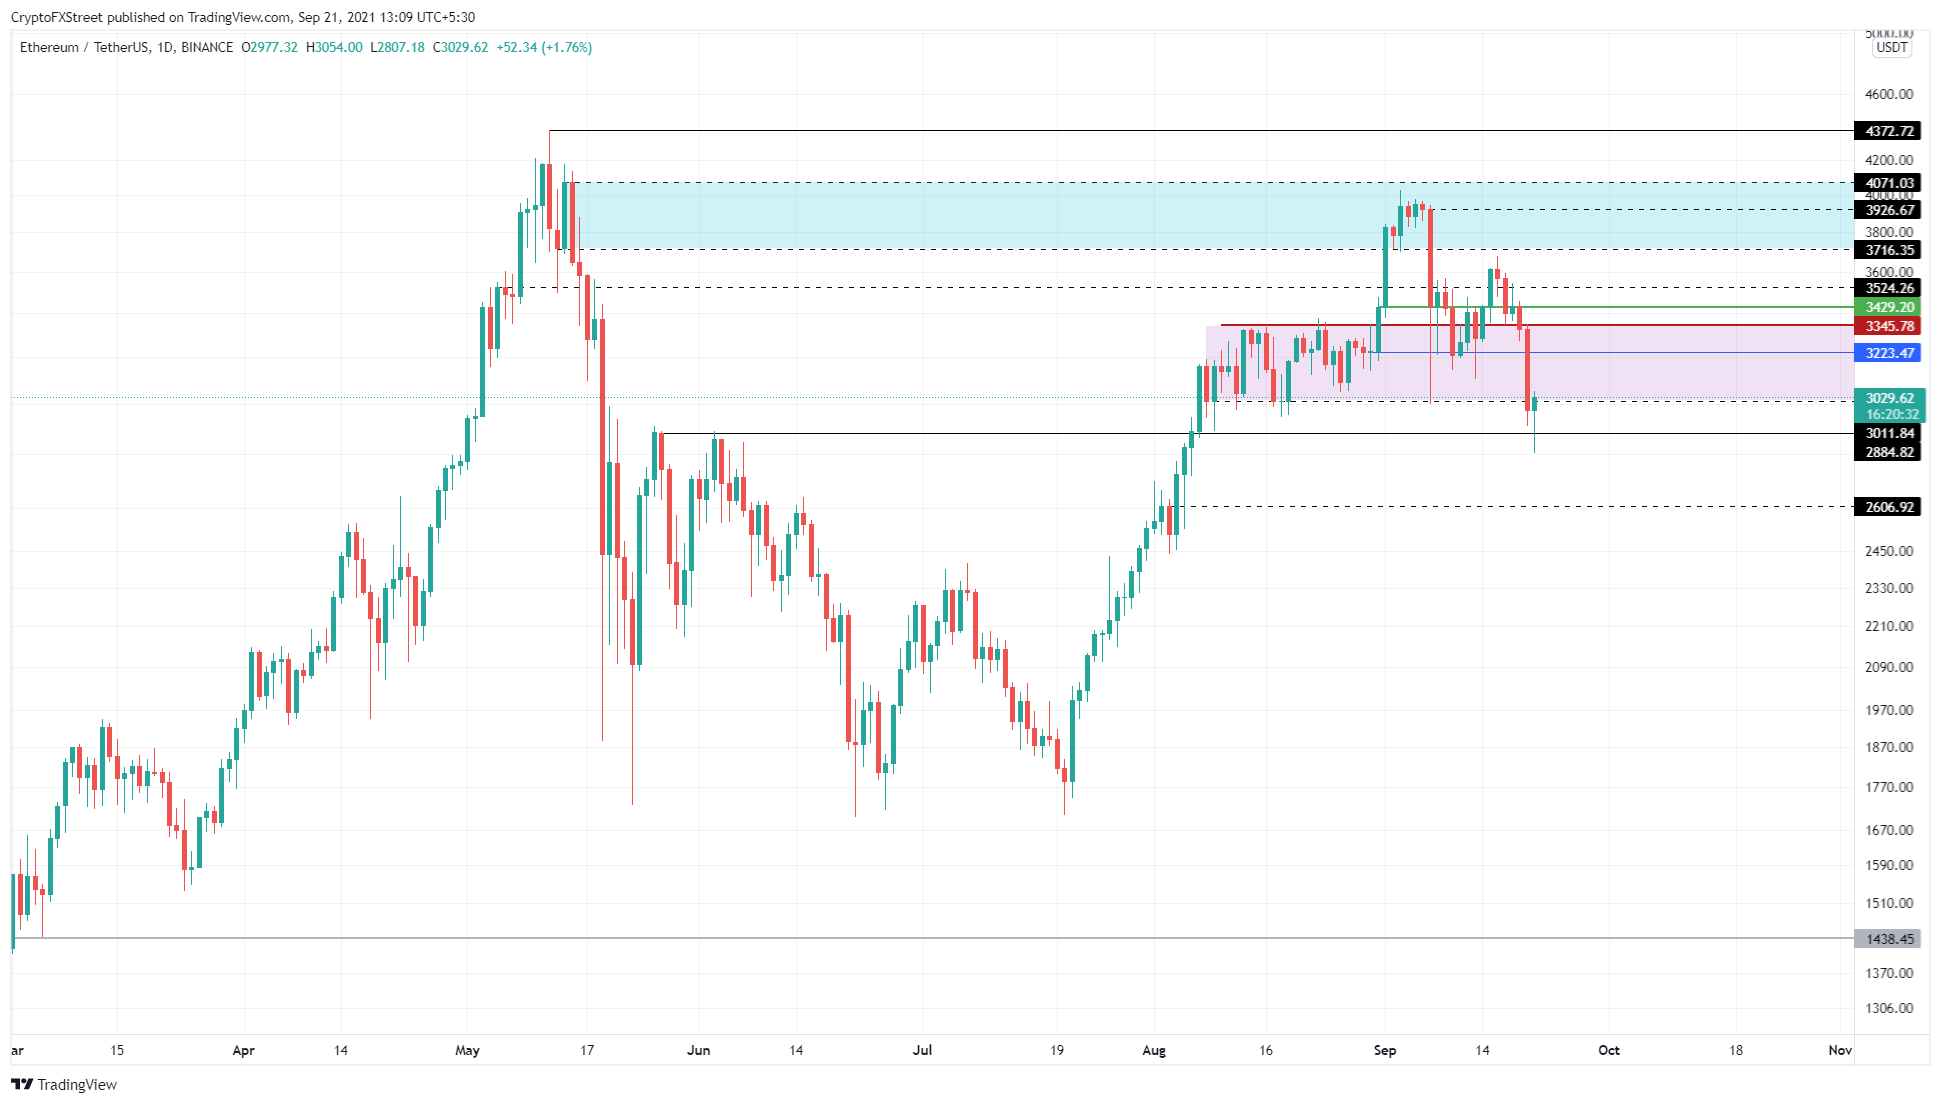
Ethereum price was on a healthy uptrend after the September 7 crash, but things turned around quickly when BTC fell. ETH dropped straight through the demand zone, extending from $3,015 to $3,338.
However, unlike the big crypto, Ethereum price closed below the lower limit of the said barrier at $3,015. ETH is trying to climb back up, but this area contains huge consolidation candles, so it will be extremely hard for a short-term spike in buying pressure to breach this.
Clearing the $3,223 hurdle will be the first confirmation signal that an uptrend is on its way. Only a decisive close above $3,338 will reveal that further upside is possible.
In the case that the smart-contract token does follow through, it will encounter the $3,429 ceiling. Following this, ETH needs to compete and rise past the September 16 swing high at $3,676.
If the buying pressure persists, investors can expect Ethereum price to make a run at the Fair Value Gap (FVG), ranging from $3,716 to $4,071.
ETH/USDT 1-day chart
On the other hand, if Ethereum price fails to scale the demand zone, stretching from $3,015 to $3,338. It will reveal an increased selling pressure and knock ETH down to $2,884. A decisive close below this barrier will create another lower low, signaling the invalidation of the bullish thesis.
Such a move also opens the path for potential crashes.
Ripple price in the same boat as Ethereum
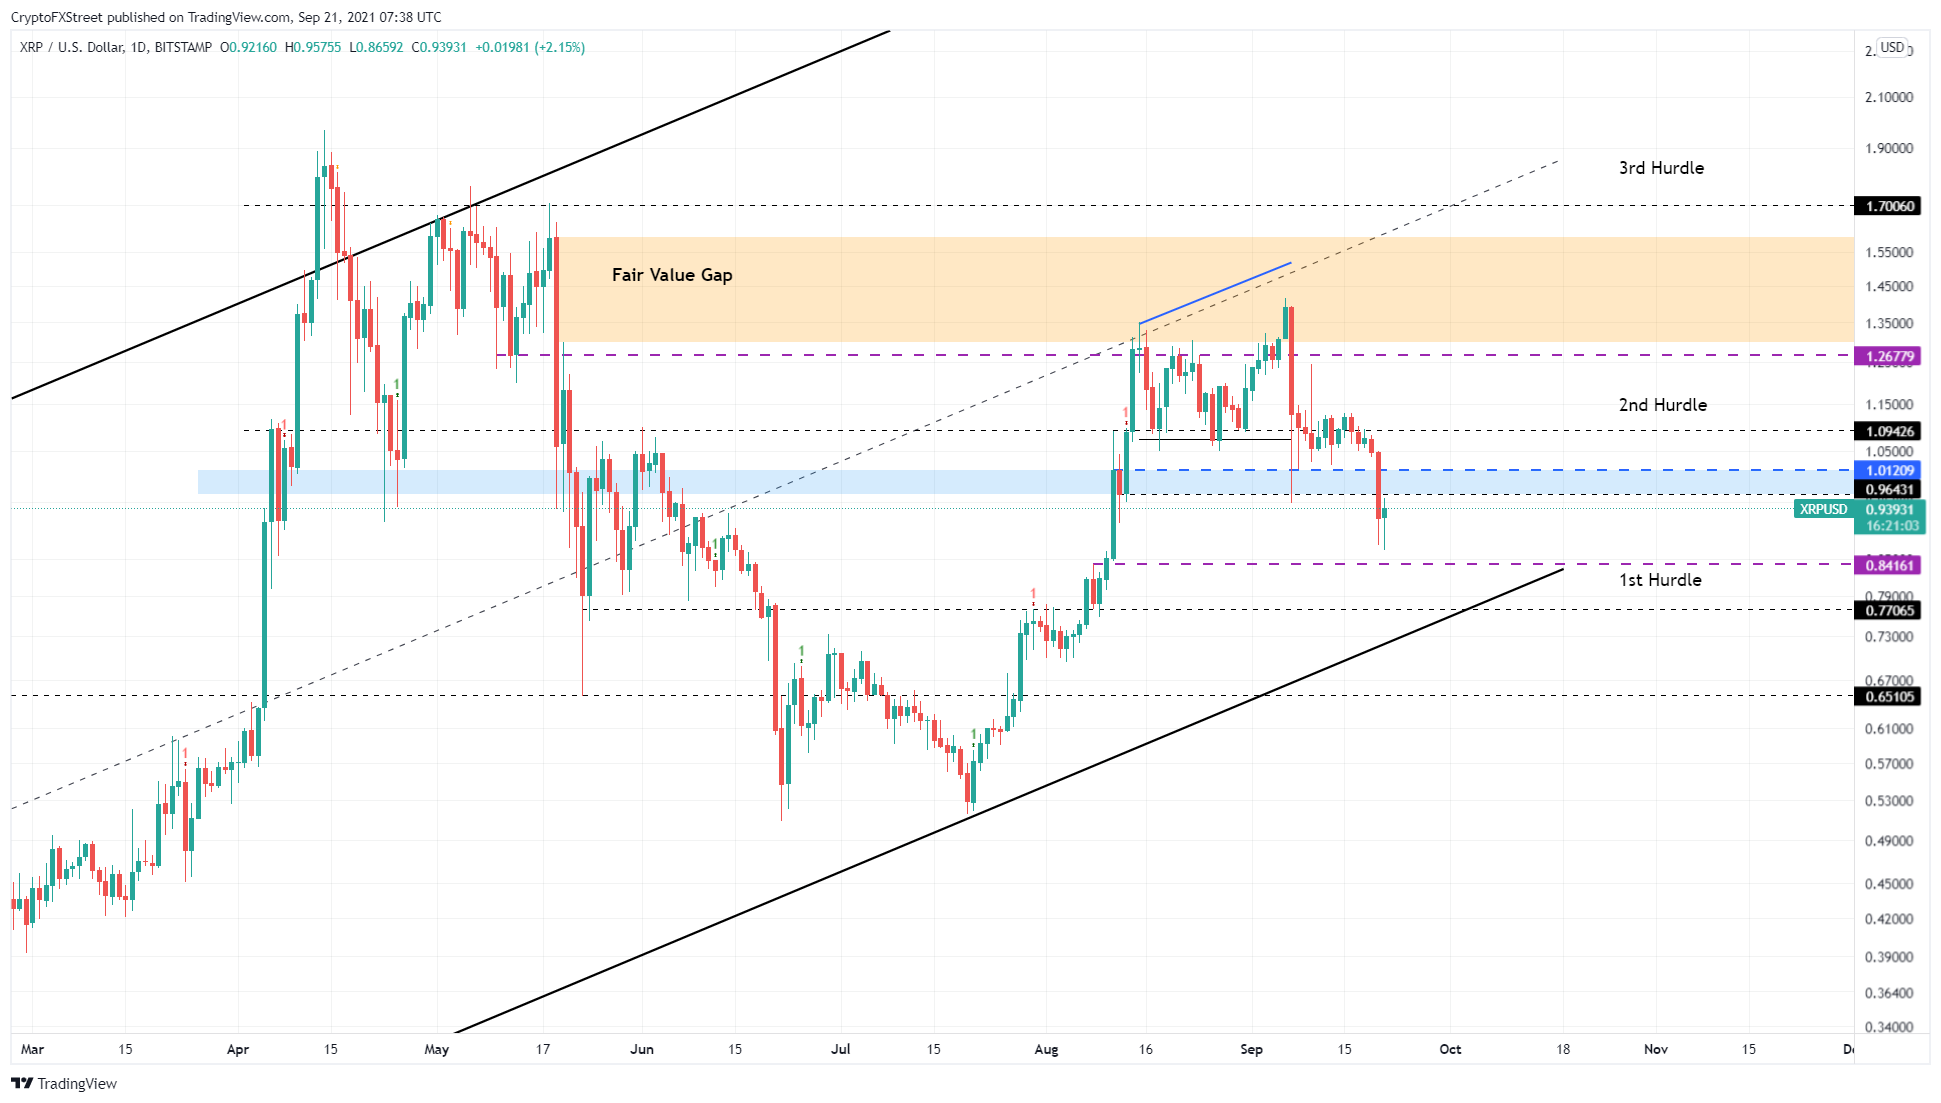
Ripple price also sliced through a demand zone ranging from $1.012 to $0.964 during the crash witnessed on September 20-21. At the time of writing, XRP price is trading just above the lower limit of the said support area at $0.964.
A potential spike in buying pressure that pushes the remittance token to produce a decisive close above $1.012 will confirm the resurgence of bulls. This development might trigger a FOMO among buyers who want to get in on the recovery rally and push XRP price to the immediate hurdle at $1.09.
Clearing this level will leave the bulls to retest the $1.267 resistance ceiling. This climb would constitute a 35% ascent from the current position.
XRP/USD 1-day chart
While many altcoins are recovering quickly, things are not looking great for Ripple price. A continuation of the downtrend, leading to a breakdown of the $0.846 support floor, will set a lower low and invalidate the bullish thesis.
Such a move will allow the bears to knock the XRP price down to $0.771.


