- Bitcoin price is bouncing off the demand zone extending from $44,705 to $46,031, showing signs of restarting an uptrend.
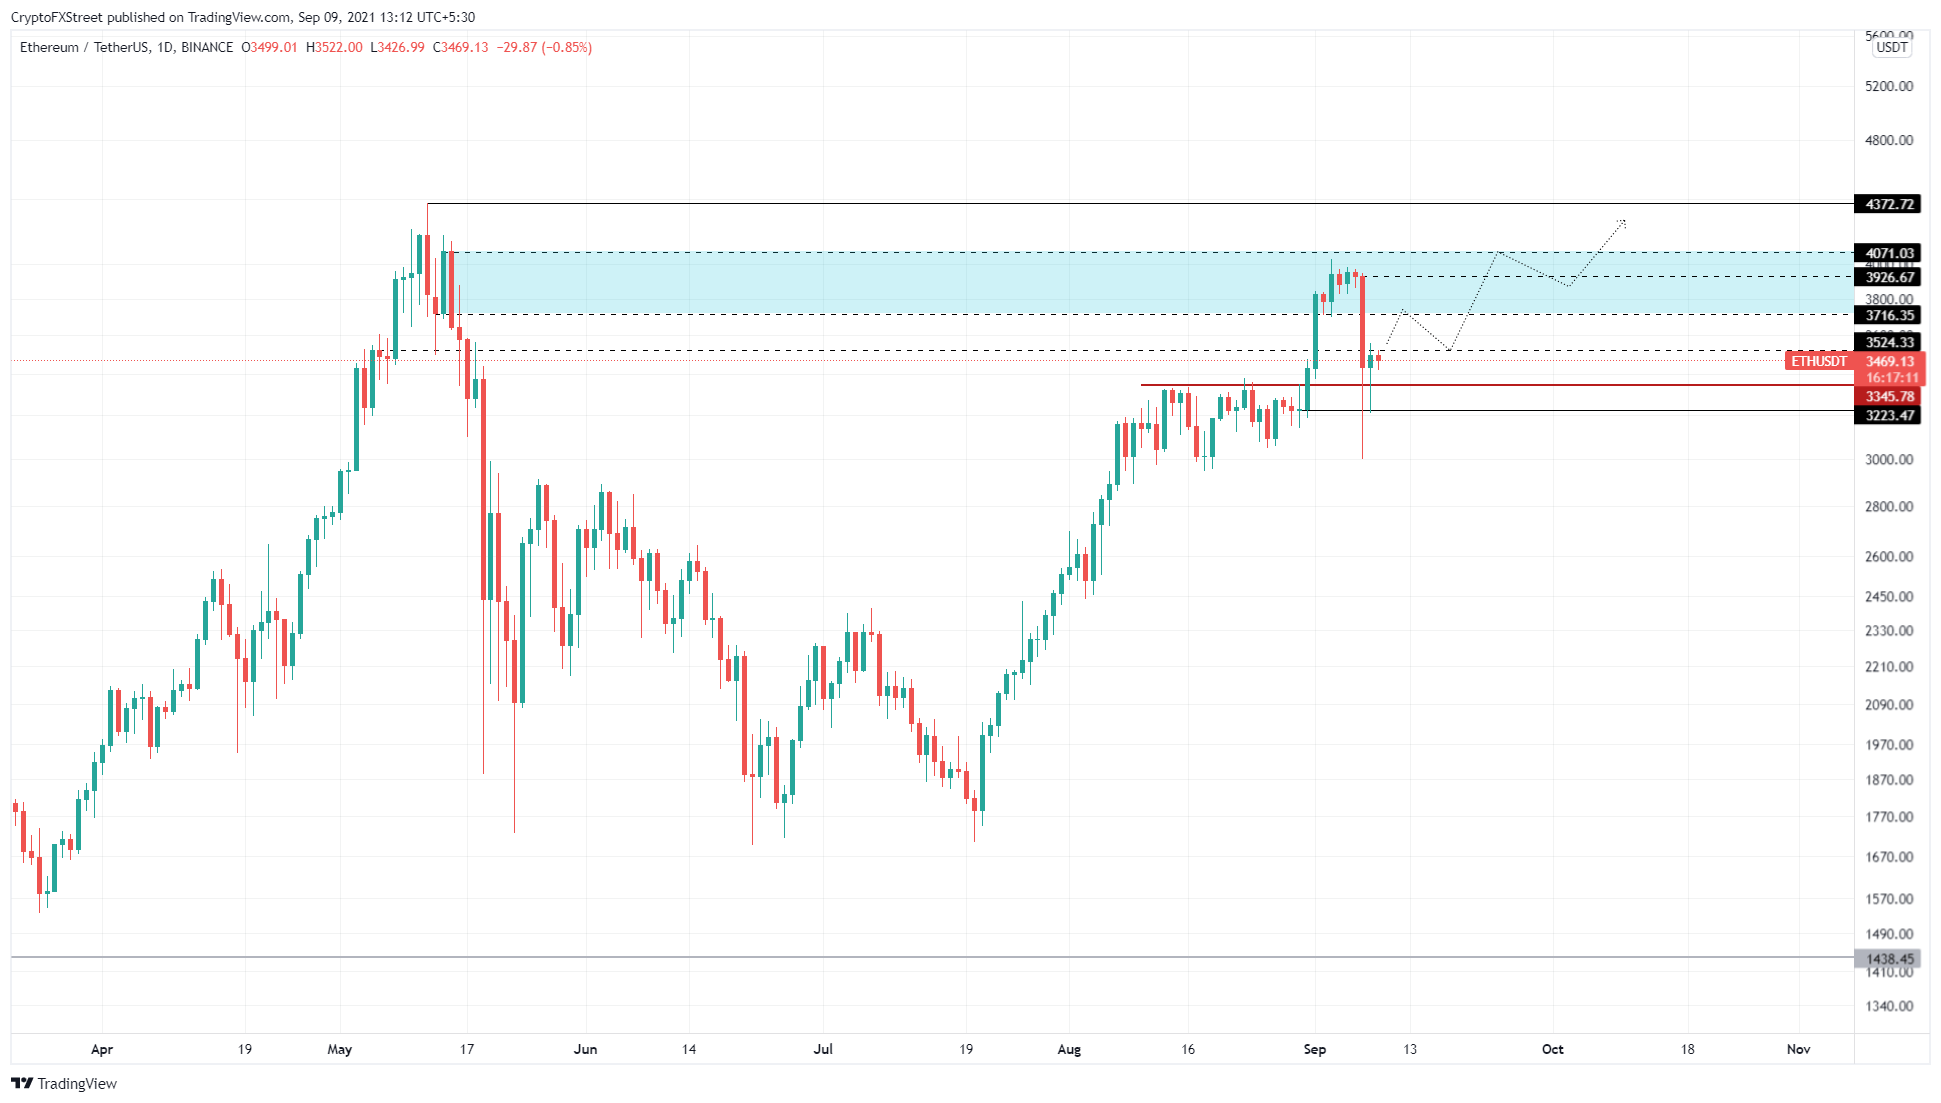
- Ethereum price is grappling with the $3,488 resistance level, anticipating a retest of $4,000.
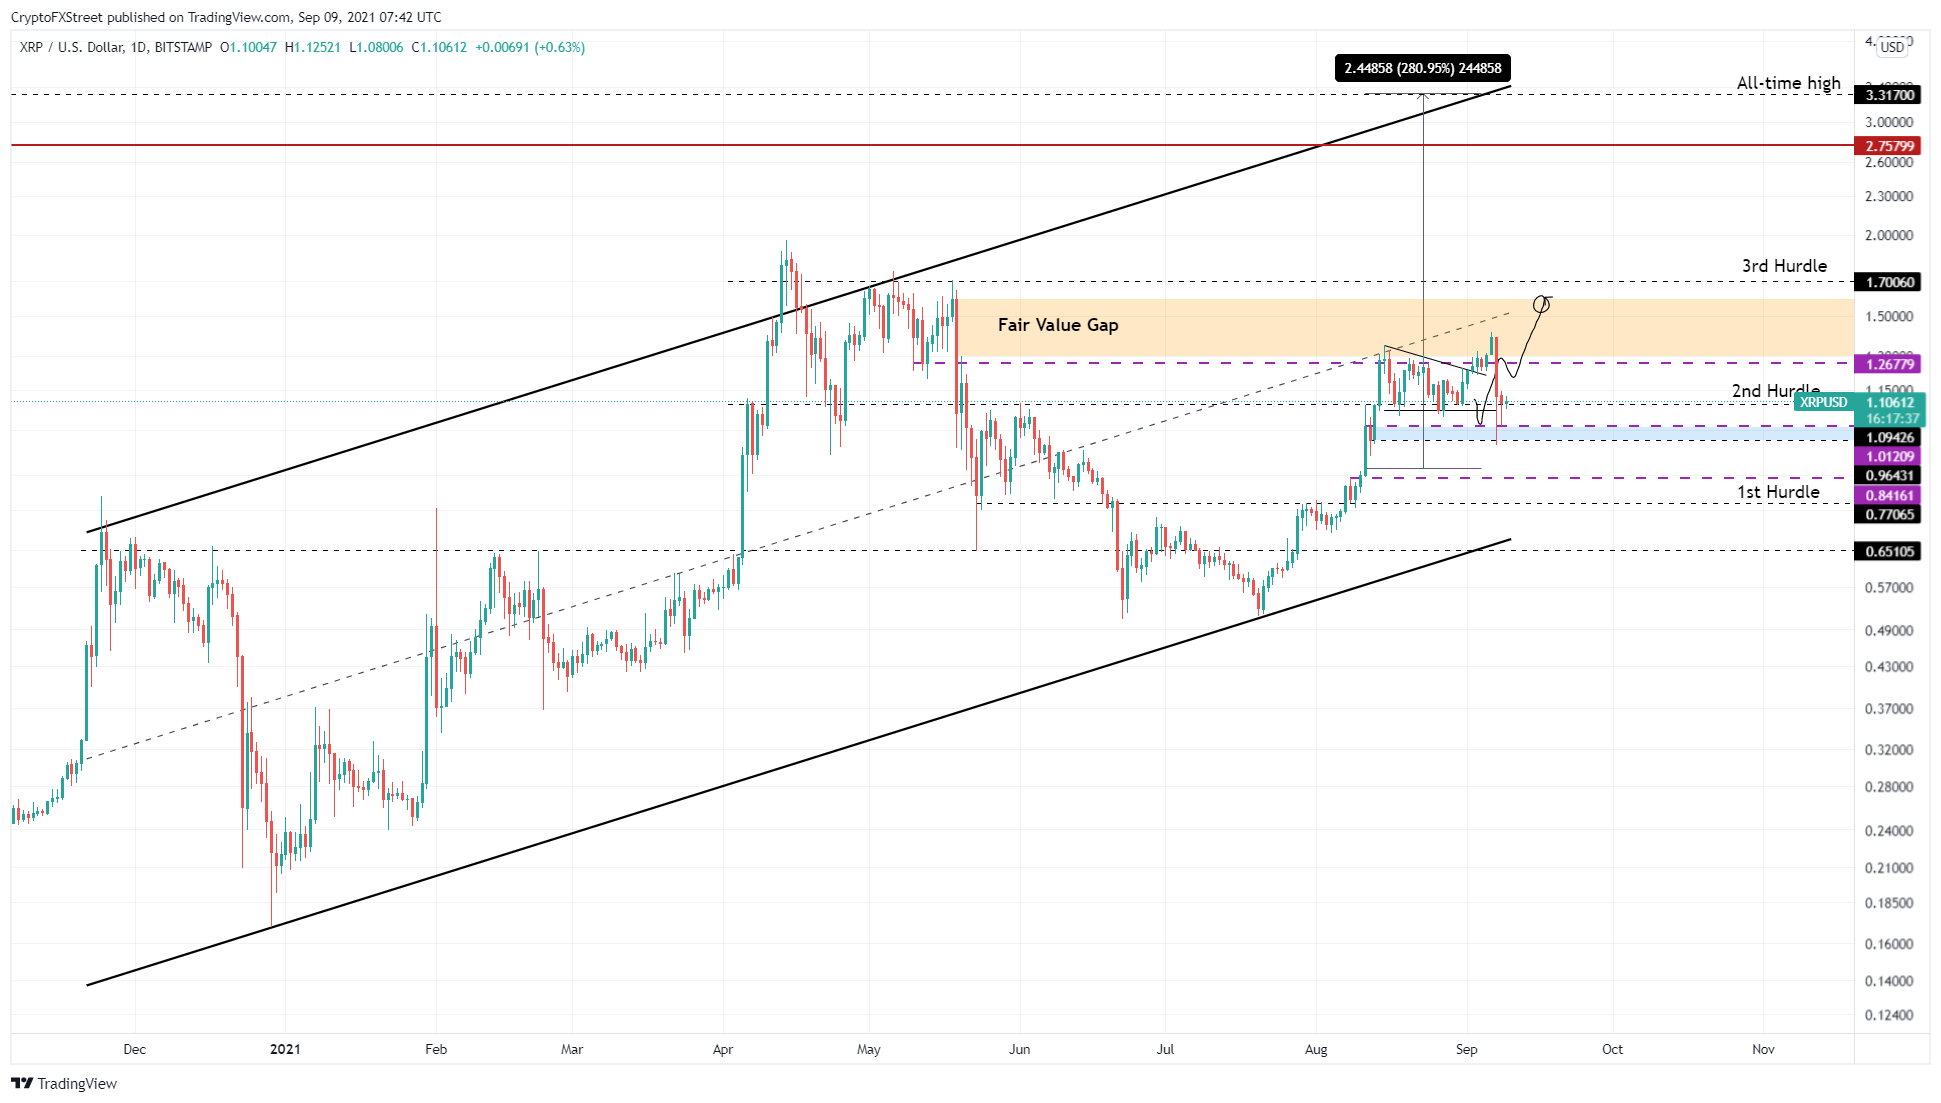
- Ripple price prepares for a 45% lift-off from the second hurdle at $1.09.
Bitcoin price suffered a fatal crash on September 7, which rippled out into the entire ecosystem as the altcoin tumbled. While this short-term sell-off wiped off gains accrued over the past month, things seem to be turning around as altcoins initiate a recovery phase.
Bitcoin price shows promise
Bitcoin price dropped 16% on September 7 but ended the day with an 8% decline. The demand zone, ranging from $44,705 to $46,031, absorbed the incoming selling pressure and might even trigger an uptrend.
However, BTC needs to close above $46,833 to confirm the start of a new rally. Doing so will open the path up to $52,666, roughly a 12% advance.
BTC/USDT 1-day chart
Regardless, a failure to slice through $46,863 will indicate the bulls’ inability to push through. This bearish outlook could compound, triggering another downswing. If the resulting selling pressure shatters the lower limit of the demand zone at $44,705, it will invalidate the bullish thesis.
Ethereum price hurries to recover losses
Ethereum price shed 23% during the crash but closed the day after a 12% decline. However, the September 8 daily candlestick was green and shows that the buyers are accumulating. Similar to Bitcoin’s position, ETH needs to slice through the $3,524 and $3,716 resistance levels to kick-start the uptrend.
In total, a run-up to $3,926 will constitute a 13% ascent, but ETH bulls might extend this uptrend to tag the $4,000 psychological level.
In some cases, if the bid orders continue to pile up, Ethereum price may even retest the all-time high at $4,372.
ETH/USDT 1-day chart
Unlike Bitcoin, Ethereum price has a lot of support to the downside and faces no imminent threat. A decisive close below $3,345 will push ETH into a phase of choppy price action or a consolidative phase. However, if ETH produces a lower low below $3,223, it will open the possibility of a shift in trend favoring the bears and invalidate the bullish thesis.
Ripple price sets its eyes on 45% advance
Ripple price experienced a 31% crash on September 7, but the situation improved, causing the daily candlestick to close around -19%. The recent sell-off did not affect the massive ascending parallel channel pattern.
However, unlike the big crypto and the smart contract token, XRP price has begun its uptrend as it bounced off the second hurdle at $1.09.
Investors can expect the remittance token to rally at least 15% before encountering a stiff resistance barrier at $1.27. Following a flip of this ceiling into a support floor, market participants can assume that the uptrend will extend up to $1.60, coinciding with the upper limit of the fair value gap.
In some cases, the uptrend could propel XRP price to the third hurdle at $1.70, allowing Ripple to retest the 2021 highs at $1.97.
XRP/USDT 1-day chart
On the other hand, Ripple price could head south if it fails to hold above the $1.09 support floor. This move will push XRP price down to the demand zone extending from $0.964 to $1.01. A decisive daily candlestick close below $0.964 will invalidate the bullish thesis for the remittance token and open the path for further losses.


