
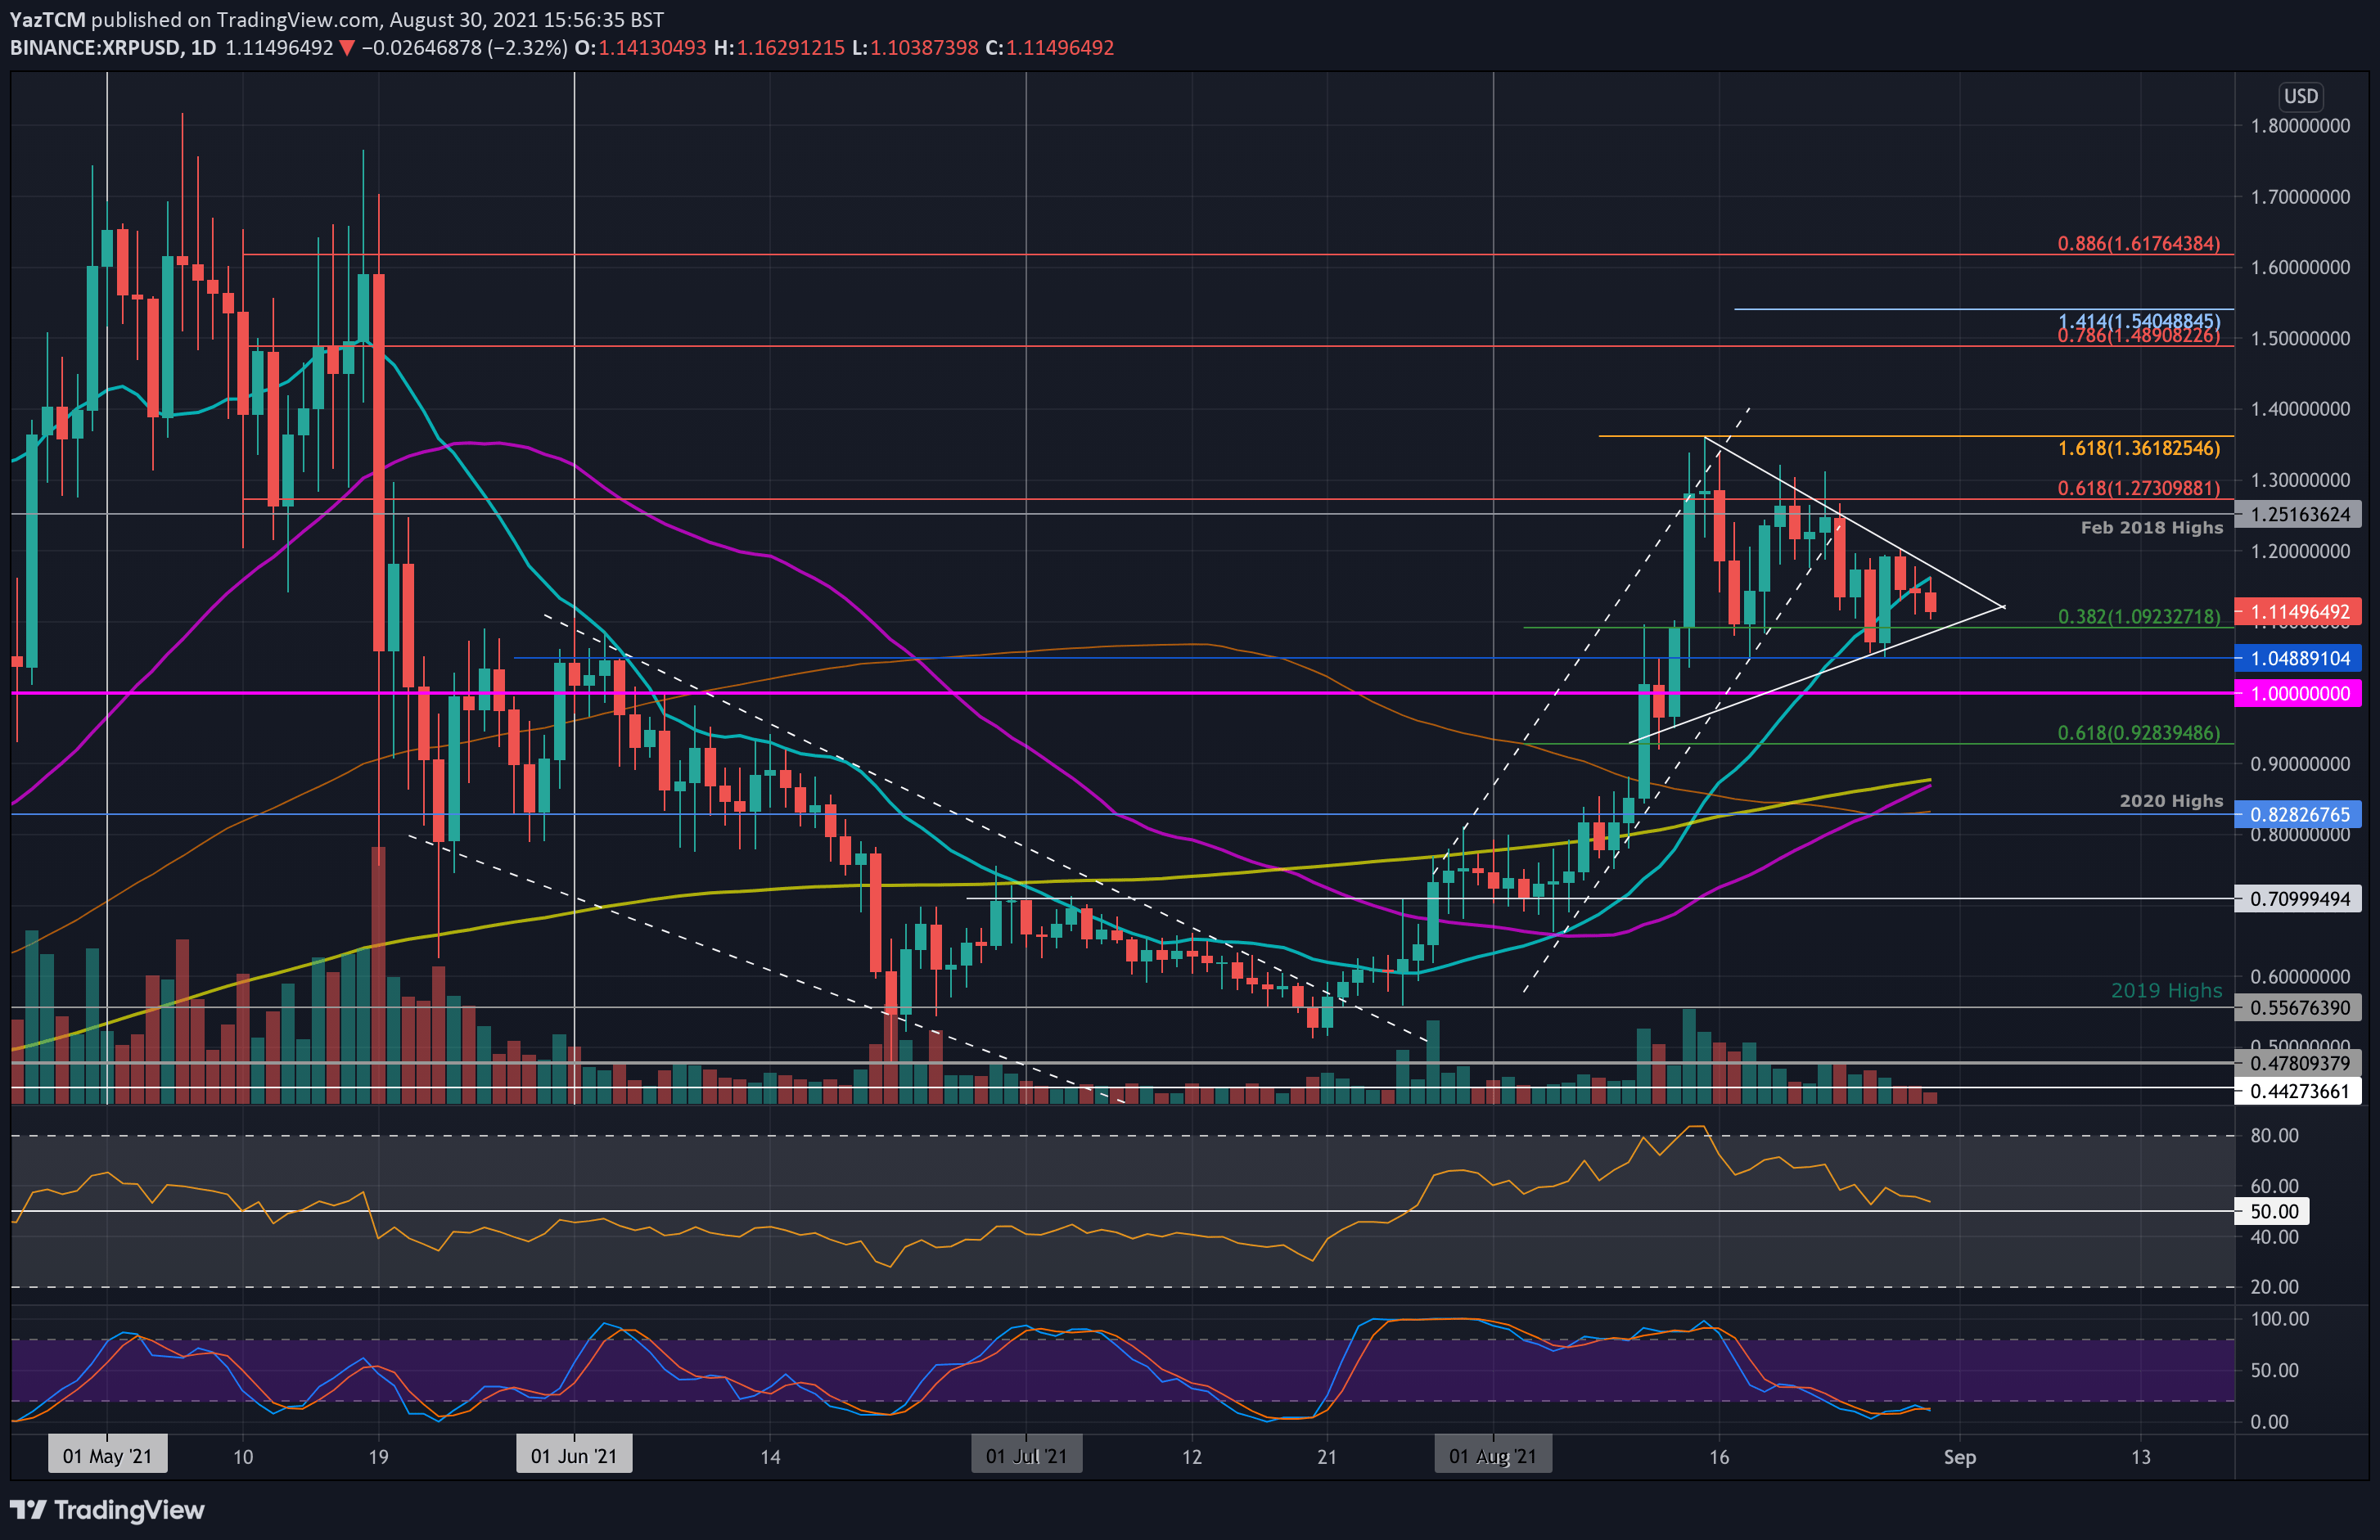
XRP/USD – XRP Falls Beneath 20-day MA and Forms Triangle.
Key Support Levels: $1.10, $1.05, $0.92.
Key Resistance Levels: $1.25, $1.28, $1.36.
XRP failed to break $1.27 (bearish .618 Fib) last week on the third attempt to overcome the level. As a result, the coin started to fall throughout the week until support was found on Thursday at around $1.05, provided by the lower angle of the triangle.
It rebounded from there over the weekend but could not break the upper angle of the triangle at around $1.20. As a result, XRP fell beneath the 20-day MA today as it heads lower. The apex of the triangle is quickly approaching, and a breakout in any direction can still be expected.
XRP-USD Short Term Price Prediction
Looking ahead, the first support lies at $1.10 (.382 Fib & lower angle of the triangle). This is followed by $1.05, $1.00, and $0.928 (.618 Fib).
On the other side, the first resistance lies at $1.15 (20-day MA & upper angle of triangle). This is followed by $1.27 (bearish .618 Fib), $1.36 (1.618 Fib Extension), $1.49 (bearish .786 Fib), and $1.61 (bearish .886 Fib).
The RSI is heading lower but still remains above the midline, indicating weak bullish momentum within the market. A break beneath the midline could send XRP beneath the triangle and back toward $1.
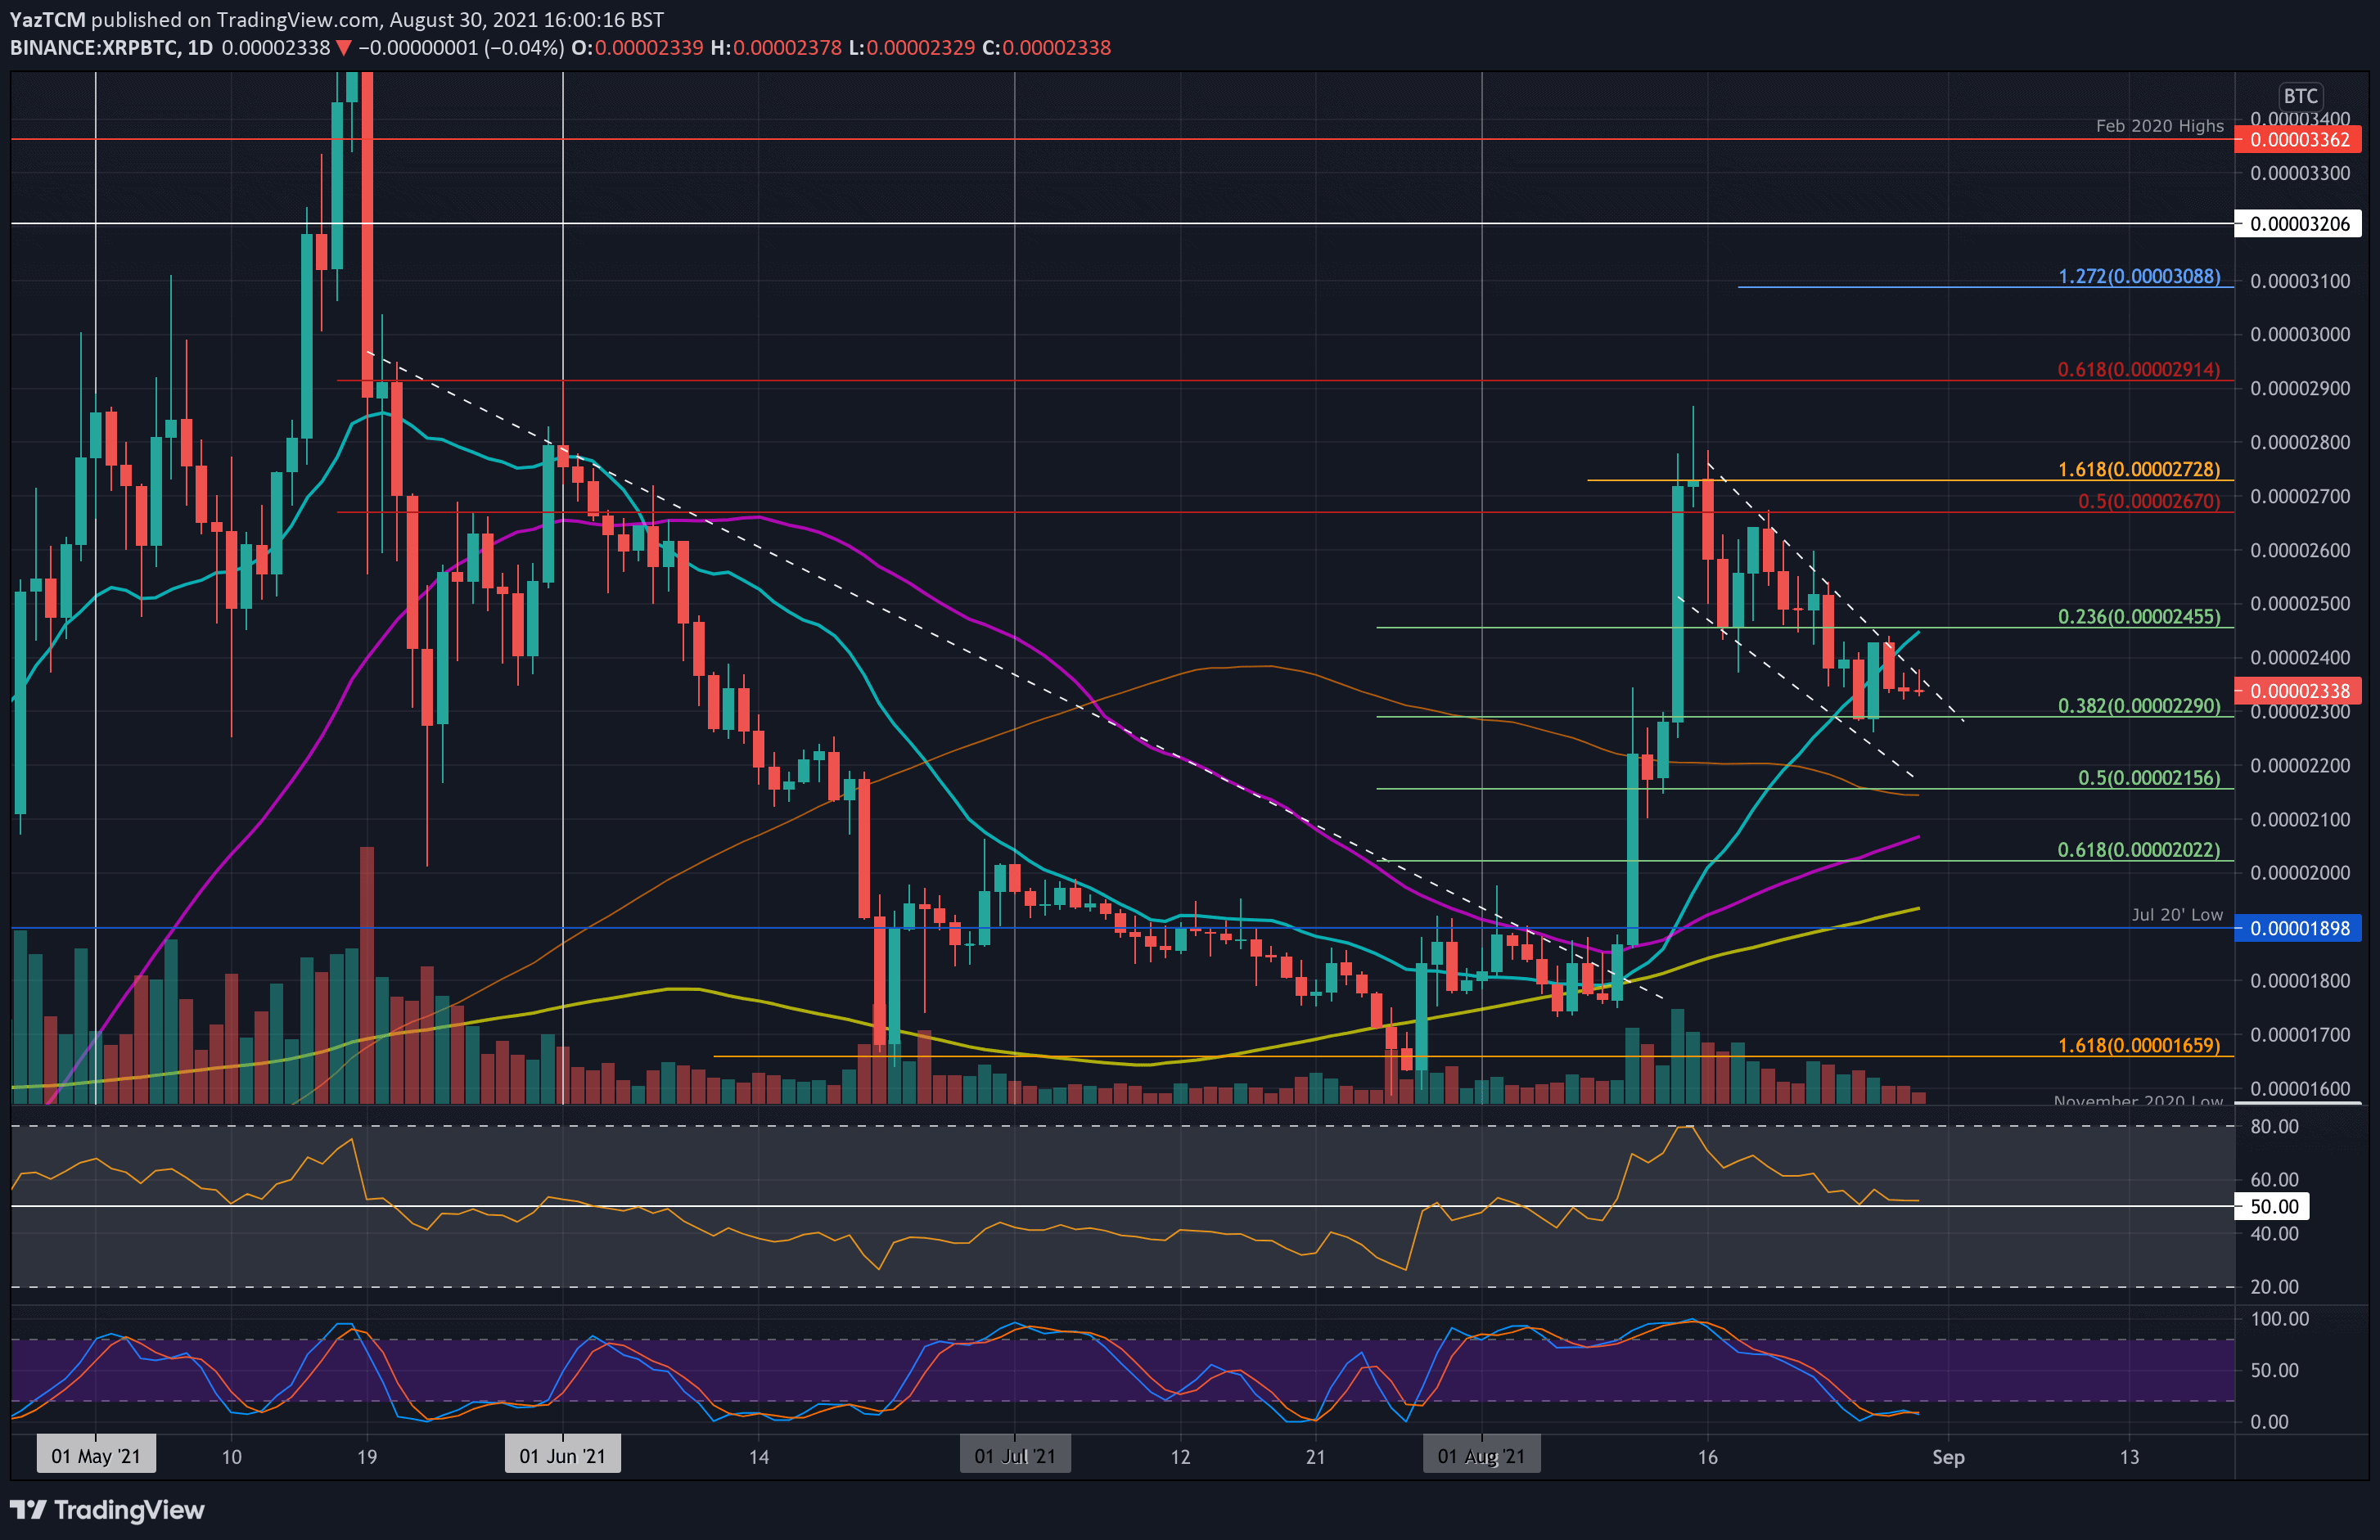
XRP/BTC – XRP Continues To Trade Inside Descending Wedge
Key Support Levels: 2290 SAT, 2150 SAT, 2000 SAT.
Key Resistance Levels: 2455 SAT, 2500 SAT, 2670 SAT.
Against BTC, XRP has been trading inside a descending wedge pattern since hitting resistance at 2730 SAT earlier in the month. Last week, the coin found support at 2290 SAT (.382 Fib Retracement) and rebounded from there on Friday.
Over the weekend, XRP failed to overcome the upper angle of the wedge and started to head lower. It is attempting to hold the support around 2300 SAT as the buyers look for a breakout toward the upside of the wedge.
XRP-BTC Short Term Price Prediction
Looking ahead, the first support lies at 2290 SAT (.382 Fib). This is followed by 2156 SAT (.5 Fib & 100-day MA), 2000 SAT (.618 Fib), and 1900 SAT (200-day MA).
On the other side, the first resistance lies at the upper angle of the wedge. This is followed by 2455 SAT (20-day MA), 2500 SAT, 2670 SAT (bearish .5 Fib), and 2730 SAT.
The RSI is also trading along the midline here, indicating indecision within the market.
Binance Futures 50 USDT FREE Voucher: Use this link to register & get 10% off fees and 50 USDT when trading 500 USDT (limited offer).
PrimeXBT Special Offer: Use this link to register & enter POTATO50 code to get 50% free bonus on any deposit up to 1 BTC.
Disclaimer: Information found on CryptoPotato is those of writers quoted. It does not represent the opinions of CryptoPotato on whether to buy, sell, or hold any investments. You are advised to conduct your own research before making any investment decisions. Use provided information at your own risk. See Disclaimer for more information.
Cryptocurrency charts by TradingView.