
Key Takeaways
- Ethereum has gained over 1,200 points since Jul. 22.
- Multiple indexes now anticipate a correction given the significant gains.
- Transaction history shows that ETH’s downside potential might be capped at $2,770.
Share this article
Market participants have rushed to buy ETH following Ethereum’s much-anticipated London hardfork. Although prices have risen due to the growing demand, some technical and on-chain metrics suggest that a spike in profit-taking is underway.
Sell Signals Appear for Ethereum
Despite the bullish momentum, Ethereum could be facing an imminent correction.
ETH has enjoyed an impressive run-up after breaking out of a descending triangle on Jul. 22. Since then, the second-largest cryptocurrency by market cap has surged by nearly 60% to reach a high of $3,200. Now that the projected target has been met, multiple red flags are beginning to pop up.
The Tom DeMark (TD) Sequential indicator has presented a sell signal on ETH’s daily chart. The bearish formation developed as a green nine candlestick, anticipating a one to four daily candlesticks correction or the beginning of a new downward countdown.
Ethereum’s Market Value to Realized Value or MVRV adds credence to the pessimistic outlook. This on-chain metric quantifies the average profit or loss of all addresses that have purchased ETH within a specific period.
The 30-day MVRV ratio is currently hovering at 26.58%, suggesting that all addresses that have bought ETH in the past 30 days sit at an average profit of 26.58%. According to behavior analytics platform Santiment, the higher the MVRV ratio, “the higher the risk that Ethereum holders will begin to sell and reduce their exposure.”
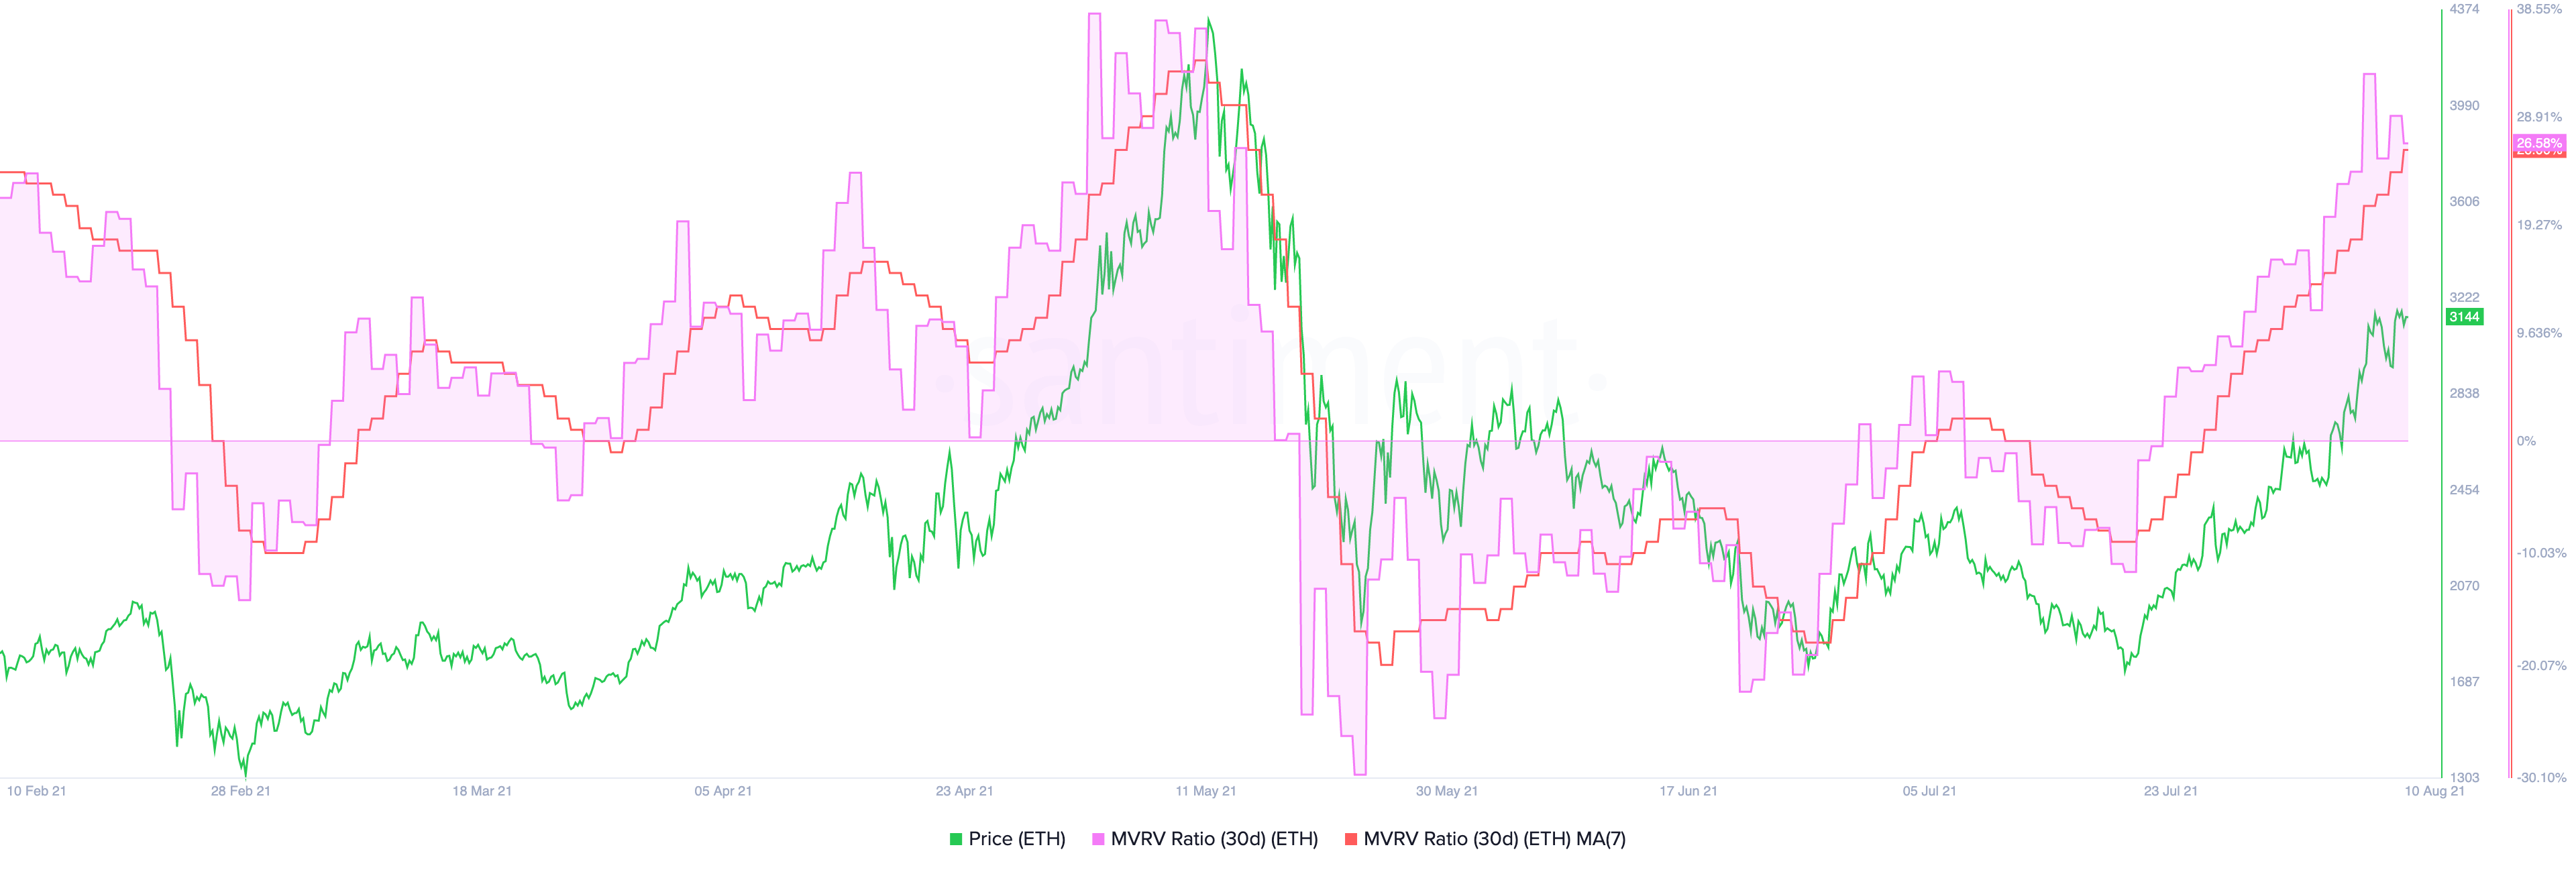
Given the significant unrealized profits among ETH holders, Ethereum is currently in a danger zone. Historical trends indicate that a spike in profit-taking may be underway, translating into a short-term correction.
Ethereum Sits on Top of Stable Support
IntoTheBlock’s In/Out of the Money Around Price (IOMAP) model reveals that Ethereum is sitting on top of multiple demand barriers that could prevent it from a sudden downswing.


The first significant interest area is between $2,960 and $3,050, where nearly 320,000 addresses have previously purchased over 1.4 million ETH. The second and most crucial support barrier lies between $2,670 and $2,860. Around this price point, more than 1.12 million addresses have acquired 2.63 million ETH.
Such a critical support wall suggests that a spike in selling pressure could be short-lived as the bears may struggle to push prices down.
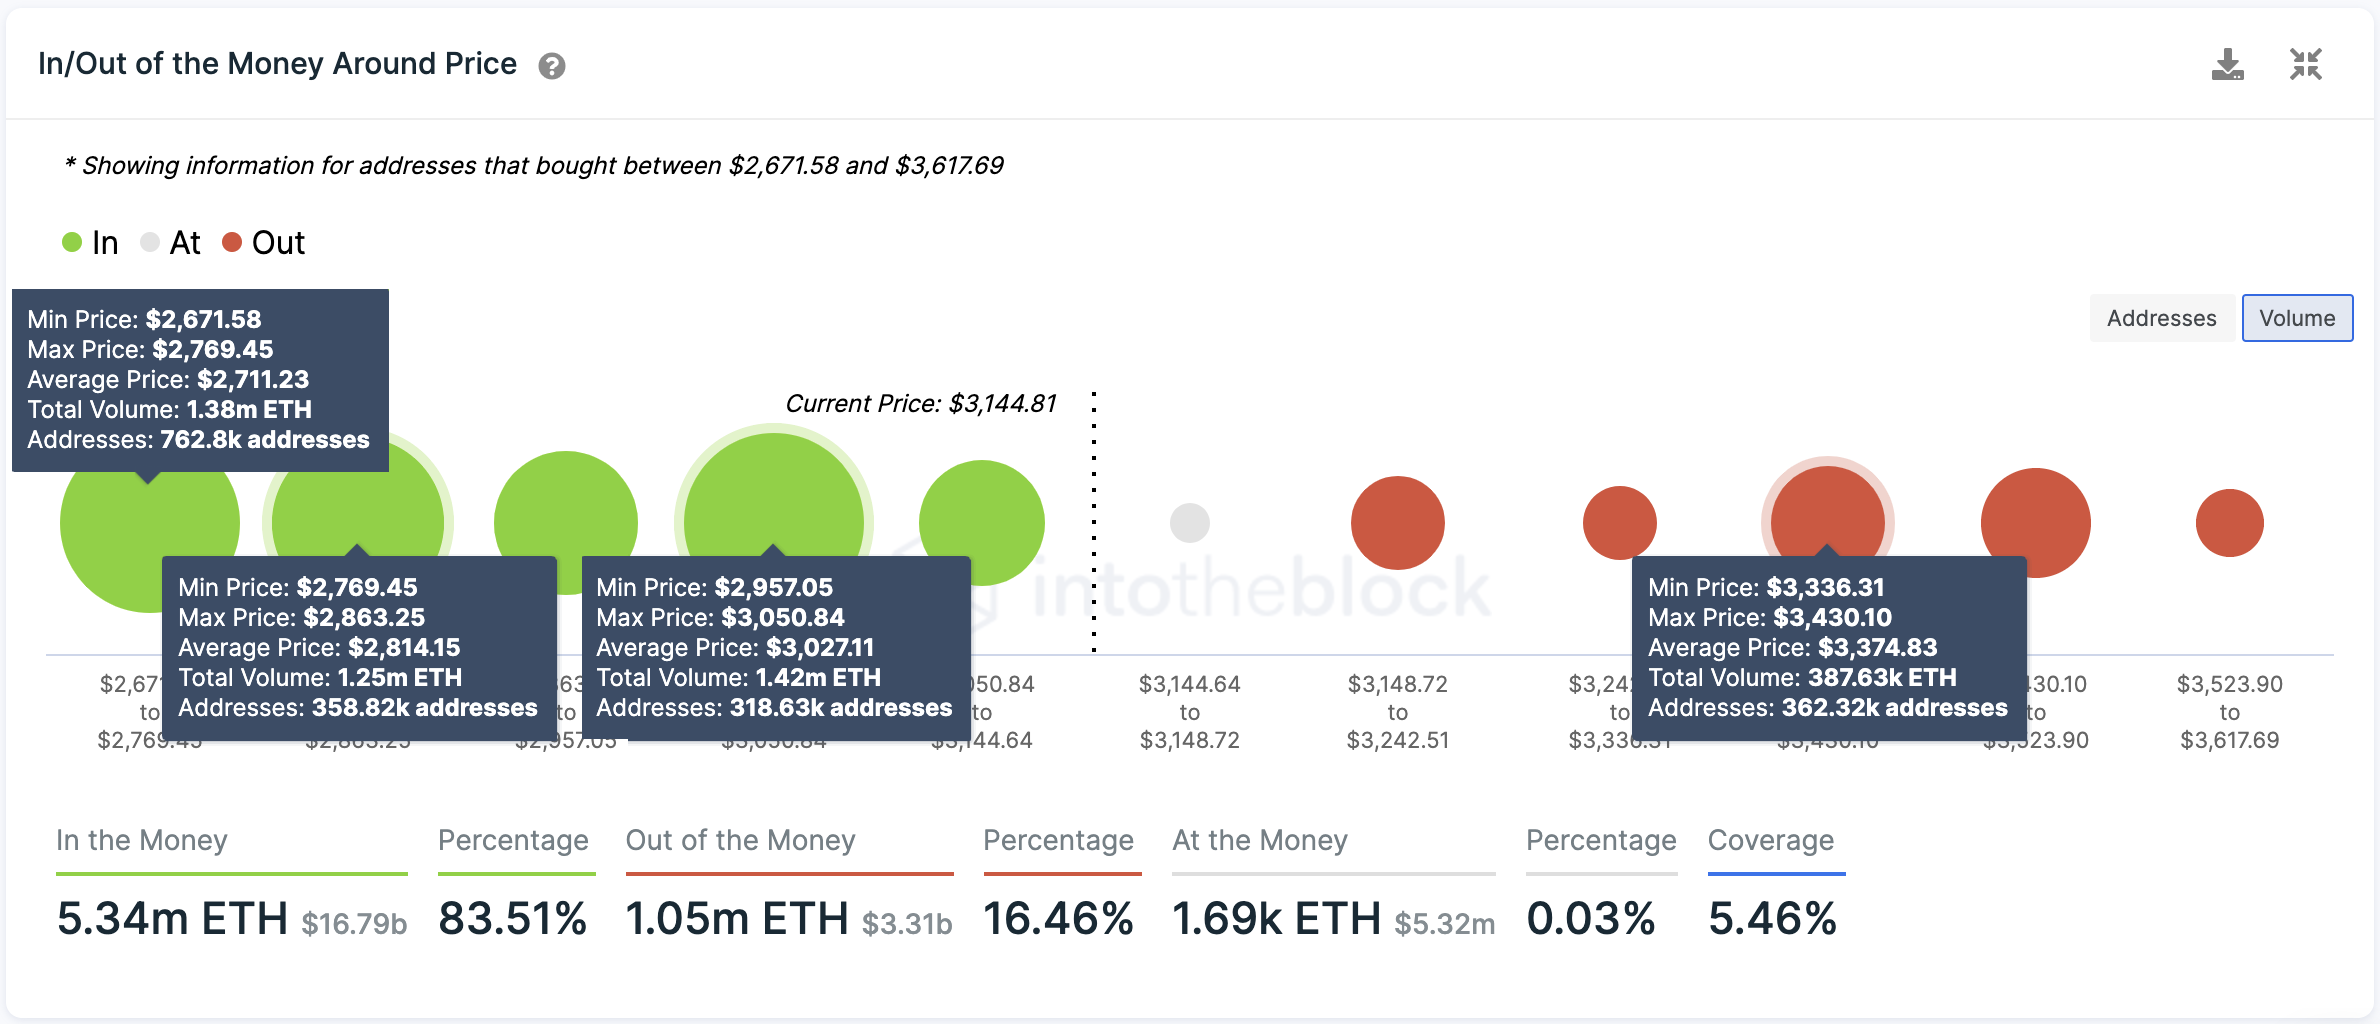
On the other hand, the IOMAP model shows no supply barrier will prevent the second-largest cryptocurrency by market cap from advancing further. There is only one area of interest between $3,340 and $3,430, where over 360,000 addresses are holding nearly 390,000 ETH.
This supply zone may have the ability to absorb some of the recent buying pressure, but if ETH can slice through this hurdle, it could climb to $3,500.

Share this article
Ethereum Back Above $3,000 Amid Supply Crunch
It’s the first time Ethereum has traded above $3,000 since May. Ethereum Rallies on EIP-1559 Ethereum has broken $3,000 for the first time since May. ETH is up around 12%…
How to Trade Using the Inverse Head and Shoulders Pattern
In stock or cryptocurrency trading, you may have heard of the term “inverse head and shoulders.” Also known as the “head and shoulders bottom” formation, the inverse head and shoulders chart pattern can…
Ethereum Launches London Hardfork Including EIP-1559
Ethereum has successfully shipped its London hardfork, including its long-awaited EIP-1559 update. Ethereum Goes Live with EIP-1559 Ethereum’s has completed its London hardfork. The number two blockchain’s latest major…