Bitcoin (BTC/USD), Ethereum (ETH/USD), Alt-Coins Price, Chart, and Analysis
- Bitcoin looking to build support off the 200-day simple moving average.
- Ethereum – just two red candles in the last three weeks.
- Alt-coin rebound continues.
The three-week rally in the cryptocurrency market continues unabated with Bitcoin up by over 50% from its recent multi-month lows while Ethereum is showing an 85% rise from its July 20 low print. While the market has taken on board the ongoing US cryptocurrency tax amendments in the US infrastructure bill, it seems as if the market is running along the lines of ‘what doesn’t kill you, makes you stronger’ and forging further ahead. As always the market is liable to turn sharply, but as we stand the charts remain pointing higher and the overall market sentiment is positive.
Bitcoin (BTC), Ethereum (ETH) Consolidating Recent Gains, Outlook Remains Positive
The alt-coin market is also driving higher with some coins registering 30%+ gains in the last week alone. Using 7-day data from CoinMarketCap, Cardano (ADA) is up 33%, Dogecoin (DOGE) is 36% higher, Uniswap (UNI) is showing gains in excess of 42%, while VeChain (VET) is up by 32%. It may be that we are seeing the start of a new alt-coin season, highlighted by Ethereum’s outperformance of Bitcoin of late.
The Ethereum/Bitcoin spread shows the outperformance of ETH vs. BTC between January and February of this year and the larger rally seen between April and mid-May when alt-coins also outperformed. The chart is now also showing a short-term bullish pennant formation, a consolidation pattern commonly seen before another move higher.
Pennant Patterns: Trading Bearish and Bullish Patterns
Ethereum/Bitcoin Daily Spread (November 2020 – August 11, 2021)
Chart via @IG.com
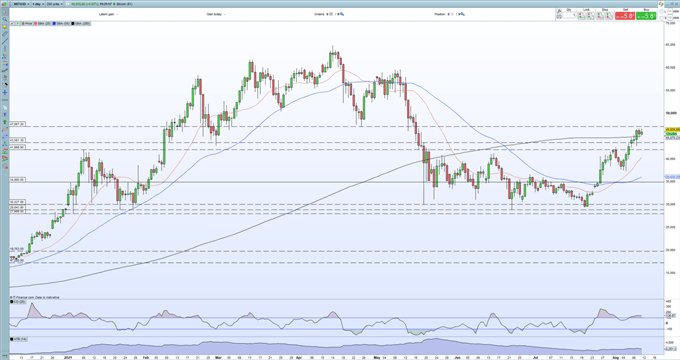
Bitcoin is now pushing to make a fresh three-month high, aided by support from the 200-day simple moving average. While further confirmation of this support over the next few days would further underpin the rally, the sharp turn higher in the 20-day sma highlights the positive sentiment in the market. Consolidation before another move higher seems likely looking at the daily BTC chart.
Trend Trading with Moving Averages
Bitcoin Daily Price Chart (November 2020 – August 11, 2021)
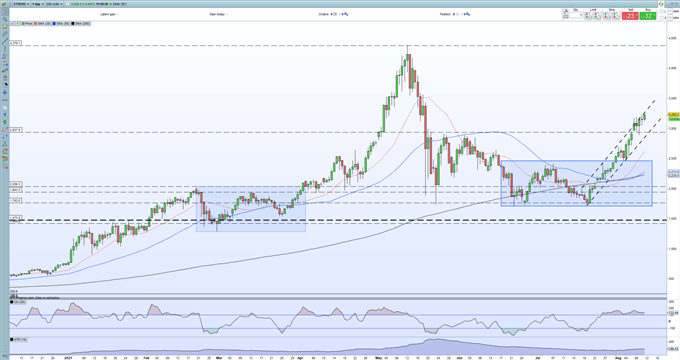
Ethereum’s chart shows the second-largest crypto by market cap in the middle of a fully-blown short-term rally with just two red (negative days) candles in the last three weeks. The basic uptrend channel is tempering any topside breakouts, while support has not been tested for nearly a week. The break higher is showing a similar pattern to the early-April breakout, a move that saw Ethereum touch $4,379 before retracing sharply.
Ethereum Daily Price Chart (November 2020 – August 11, 2021)
What is your view on Bitcoin and Ethereum – bullish or bearish?? You can let us know via the form at the end of this piece or you can contact the author via Twitter @nickcawley1.


