- Litecoin price could shed 50% if a key technical outlook from the descending triangle on the daily chart holds.
- The IOMAP model by IntoTheBlock shows recovery upwards faces massive resistance
- A sustained break below $113 is required to confirm a fresh bearish breakout.
Litecoin price has suffered under the strong arms of sellers since the all-time high (ATH) of $418 traded on May 07. The LTC price decline tested area under $120 to the extent of confirming support at $113 on the daily chart.
There have been numerous attempts to recover, but one of the 10 largest cryptocurrencies by market cap according to Coinmarketcap has not made any marked progress to regain the record high price.
At the time of writing, the Litecoin price teeters at $133 as it deals with bearish pressure under a descending trendline. LTC must hold above $120 if the uptrend is to be continued. However, the technical outlook on the daily chart generally indicates that Litecoin may drop further in the coming days. If this happens, it might send a significant crypto signal to buy the asset.
Litecoin Price Might Fall to $55
Litecoin price highlights a descending triangle pattern on the daily chart. A descending triangle is a common trading chart pattern, usually bearish in nature, that shows that the demand for the cryptocurrency is weakening. In some instances, however, it may be used to forecast bullish price actions.
To create a descending triangle, one draws two trendlines: one is a declining trendline that connects lower highs and another a horizontal line connecting relatively equal lows. This trend starts with a high volume but narrows as the traded volume contracts, indicating periods of price consolidation.
The horizontal trendline acts as the x-axis showing a robust bullish front, which is a key support area. However, the descending trendline acts as the triangle’s hypotenuse indicates that bears are becoming more aggressive. Ultimately, Litecoin’s (LTC) price is expected to continue rallying below the to validate the pattern.
The breakout downwards should take place before the trendlines converge and target a distance that is equal to the thickest part of the triangle. For example, LTC may be forced to shed 50% to test support at $55 before recovery is witnessed.
Litecoin Price (LTC/USD) Daily Chart
The Litecoin Price highlights a descending triangle on the daily chart.
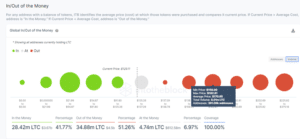
The In/Out of the Money Around Price (IOMAP) on-chain model by IntoTheBlock accentuates this bearish outlook. The technical metrics highlight major resistance upwards with the nearest major resistance between $158 and $182. Here, 391,090 addresses bought around 8 million LTC previously. Overcoming this hurdle will be an uphill task as recovery continues to delay.
Litecoin Price IOMAP Model highlights major resistance

Showing all addresses currently holding LTC
Looking on the other side, there is optimism
On the upside, the IOMAP model reveals that Litecoin price is sitting on relatively strong support areas. An increase in buying pressure may lead to an upswing forcing LTC to slice through the hypotenuse around the 20-day SMA at $136 and perhaps invalidate the bearish outlook.
This will be confirmed if LTC closes the day above this level. Moreover, the Moving Average Convergence Divergence (MACD) spells a bullish outlook as seen on the daily chart. Litecoin’s uptrend will resume as the MACD crosses the zero line into the positive zone.
If this happens, it will present a good opportunity to enter the market, and our how-to-buy cryptocurrency guide will guide you on how to do so.
Looking to buy or trade Litecoin now? Invest at eToro! (centred and bold)
Capital at risk
