ETH/USD – New 16-Day High.
Key Support Levels: $2300, $2250, $2130.
Key Resistance Levels: $2350, $2440, $2540, $2640.
Ethereum rebounded from support at $1700 (mid-March support) at the beginning of last week and surged into resistance at $2300 (bearish .5 Fib) on the first day of July. However, the second-largest crypto quickly got rejected and found support on top of the $2K mark on Friday.
Over the weekend, ETH managed to break back above the 20-day MA (yesterday) and, continued today higher, as it climbed above the June descending trend line. As of writing these lines, ETH set a new 16-day high price at approximately $2350. The last time ETH reached that price area was on June-18, 2021.
ETH-USD Short Term Price Prediction
Looking ahead, if the bulls push higher, the first major resistance beyond today’s high ($2350) lies at $2440 (bearish .618 Fib & 50-day MA). This is followed by $2540 (100-day MA), $2640 (bearish .786 Fib), and $2800.
On the other side, the first support now lies at $2300, which is the . This is followed by $2250, $2130 (20-day MA), and $2000 (Feb 2020 highs and this week’s lows from Friday).
The RSI is in the process of climbing above the midline as the buyers attempt to take control of the market momentum. If it can succeed in breaking 50, it would be the first time bulls are in control within the ETH/USD market since mid-May.
ETH/BTC – Bulls Hit 50-day MA
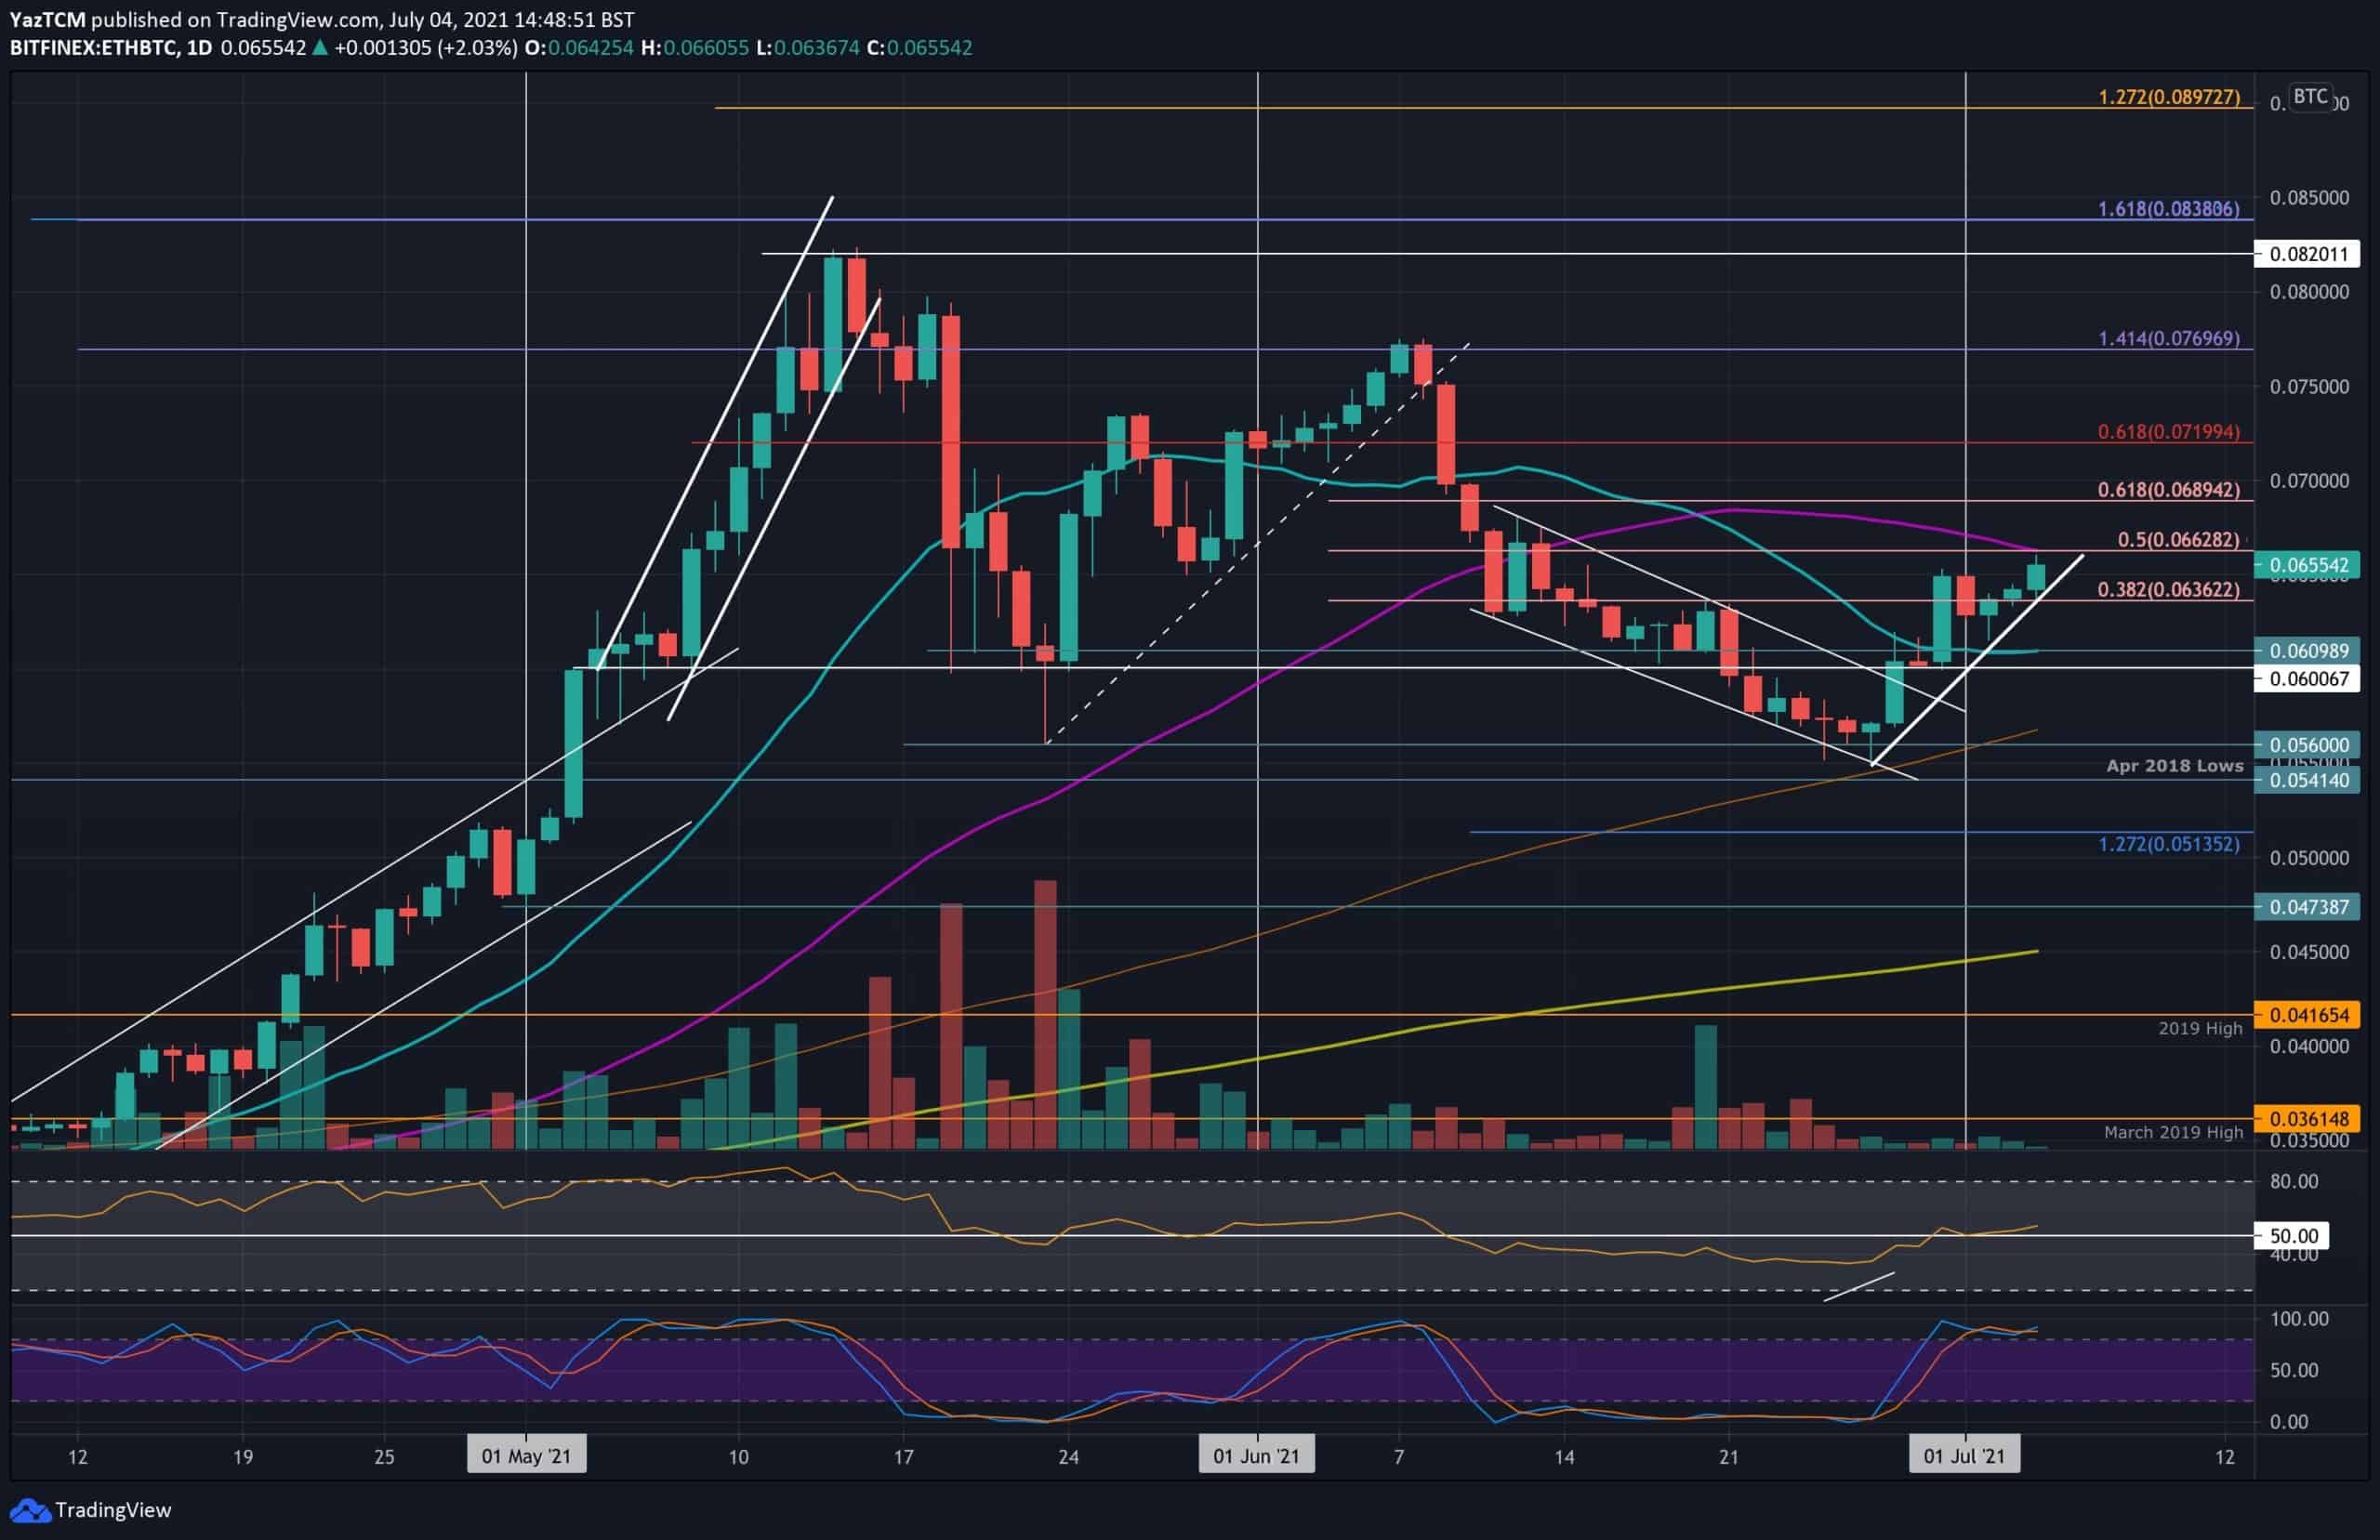
Key Support Levels: 0.065 BTC, 0.0632 BTC, 0.061 BTC.
Key Resistance Levels: 0.066 BTC, 0.069 BTC, 0.072 BTC.
Etheruem is also performing well against BTC after recoding a new 21-day high ealier today at around 0.066 BTC. The coin pushed higher from 0.06 BTC on Wednesday, to break above the 20-day MA and reach 0.065 BTC. It failed to break 0.065 BTC until today, as mentioned.
As can be seen below, ETH/BTC found support at a short-term rising trendline on Friday, and now facing resistance around 0.066 BTC provided by the 50-day MA and the bearish .5 Fib.

ETH-BTC Short Term Price Prediction
Moving forward, the first resistance lies at 0.066 BTC (50-day MA). This is followed by 0.069 BTC (bearish .618 Fib), and 0.072 BTC (long-term bearish .618 FiB).
On the other side, the first support lies at 0.065 BTC. This is followed by 0.0632 BTC, 0.061 BTC (20-day MA), and 0.06 BTC.
The RSI pushed above the midline this weekend, indicating that the buyers have taken control of the market momentum.
Binance Futures 50 USDT FREE Voucher: Use this link to register & get 10% off fees and 50 USDT when trading 500 USDT (limited offer).
PrimeXBT Special Offer: Use this link to register & enter POTATO50 code to get 50% free bonus on any deposit up to 1 BTC.
Disclaimer: Information found on CryptoPotato is those of writers quoted. It does not represent the opinions of CryptoPotato on whether to buy, sell, or hold any investments. You are advised to conduct your own research before making any investment decisions. Use provided information at your own risk. See Disclaimer for more information.
Cryptocurrency charts by TradingView.
