
Ripple (XRP)
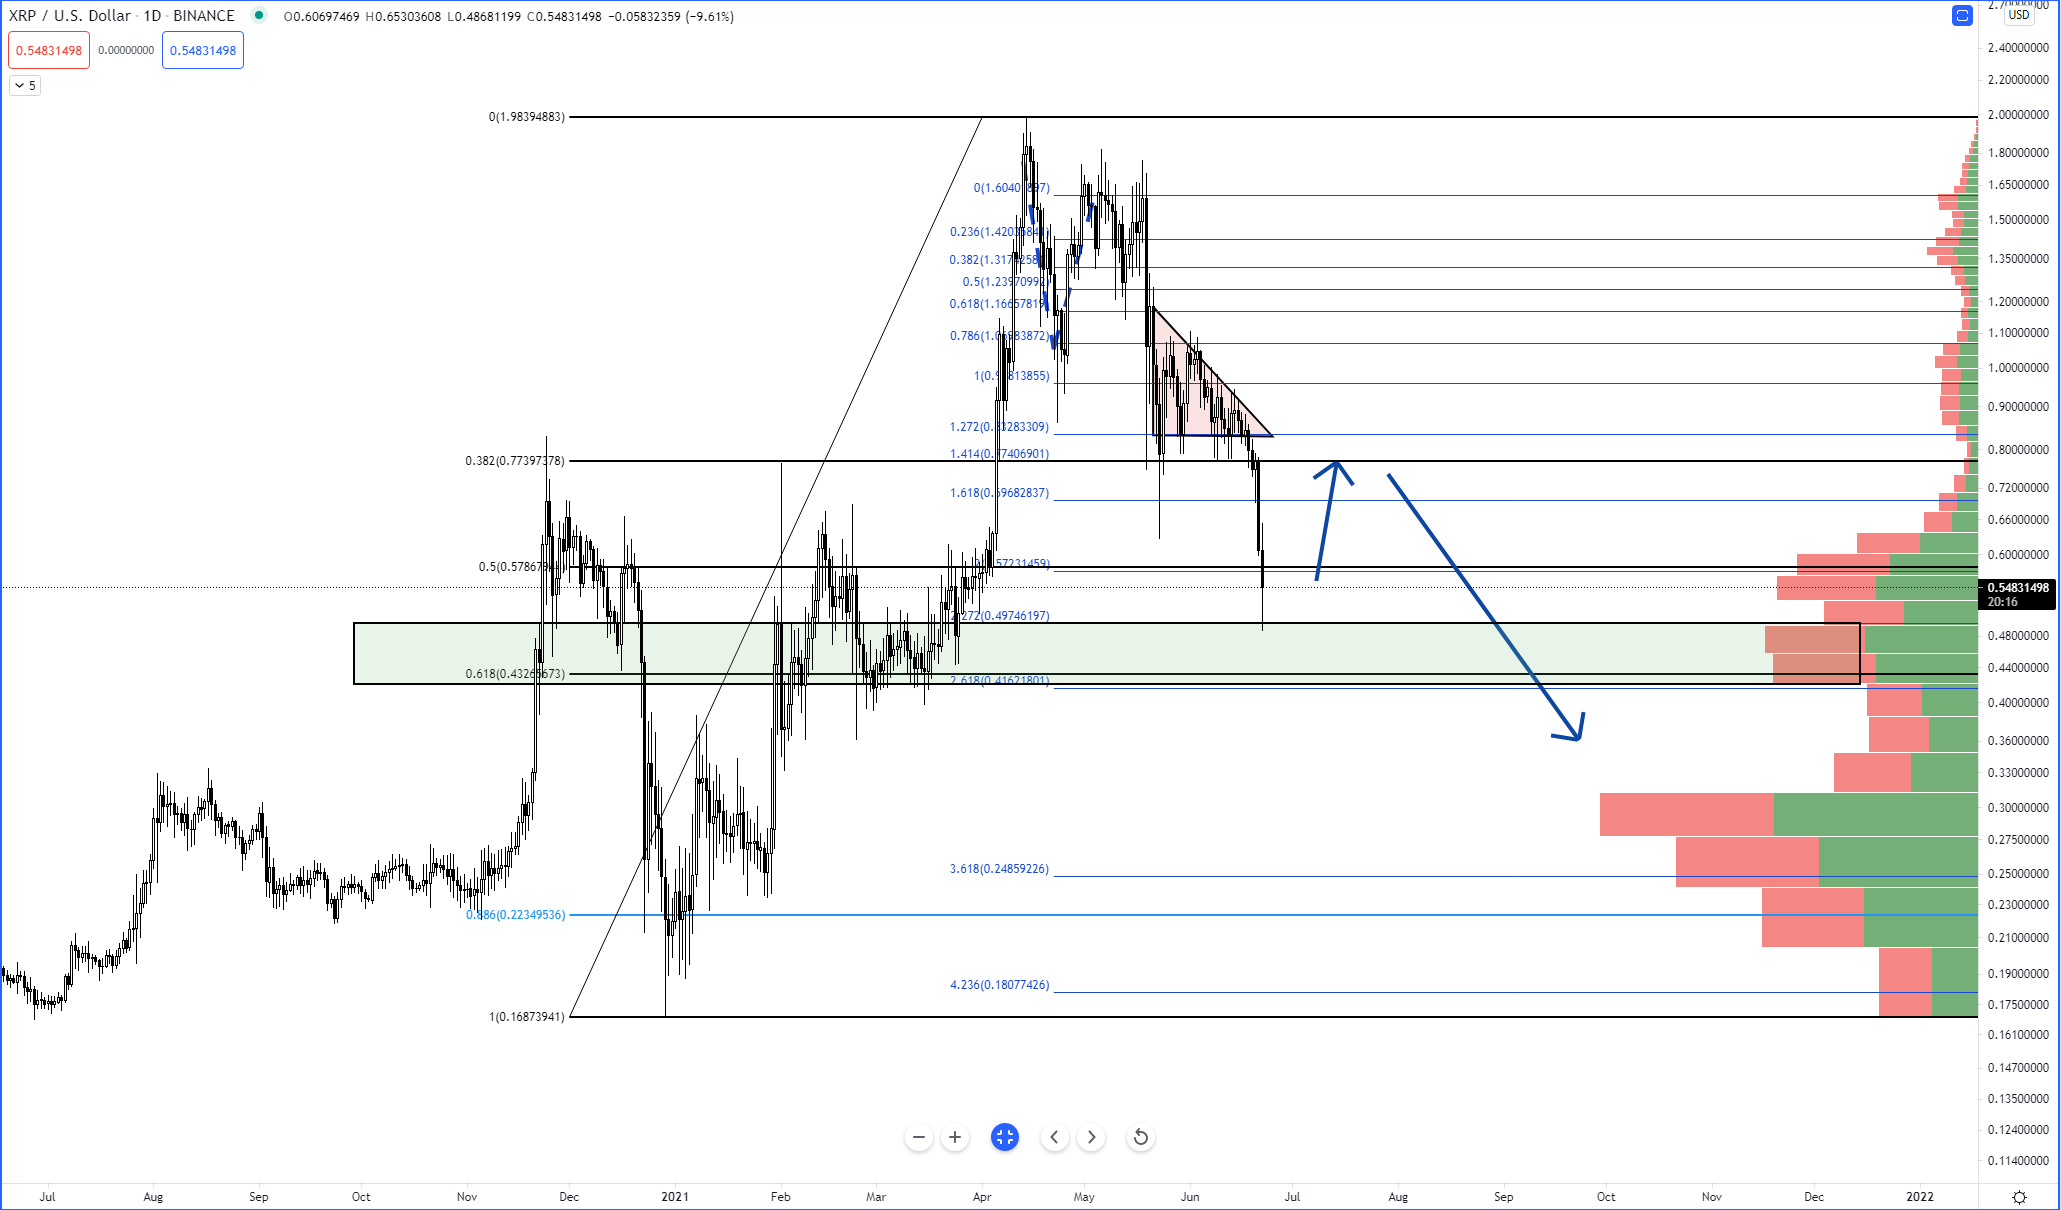
Above: Ripple (XRPUSD) Chart
Out of all the well known high market cap cryptocurrencies, Ripple (XRP) is a clear leader when it comes to how much it has dropped over the past two trading days. Monday’s close showed Ripple lost -21.60% on the day and at the time of writing this article (1940 EST), Ripple is down another -10%. However, some of the selling pressure may pause. The green highlighted zone on the chart represents a collection of support levels that could at least slow down any further selling. The 61.8% Fibonacci Retracement at $0.43, the 261.8% Fibonacci Extension at $0.41 and the top of the high volume node at $0.48 all show good reasons to expect a pause in any selling below the $0.40 level. However – watch for any move that does drop below $0.40 because that could trigger a fast and violent move to the $0.31 value area. There is zero support between $0.40 and $0.31.
Binance Coin (BNB)
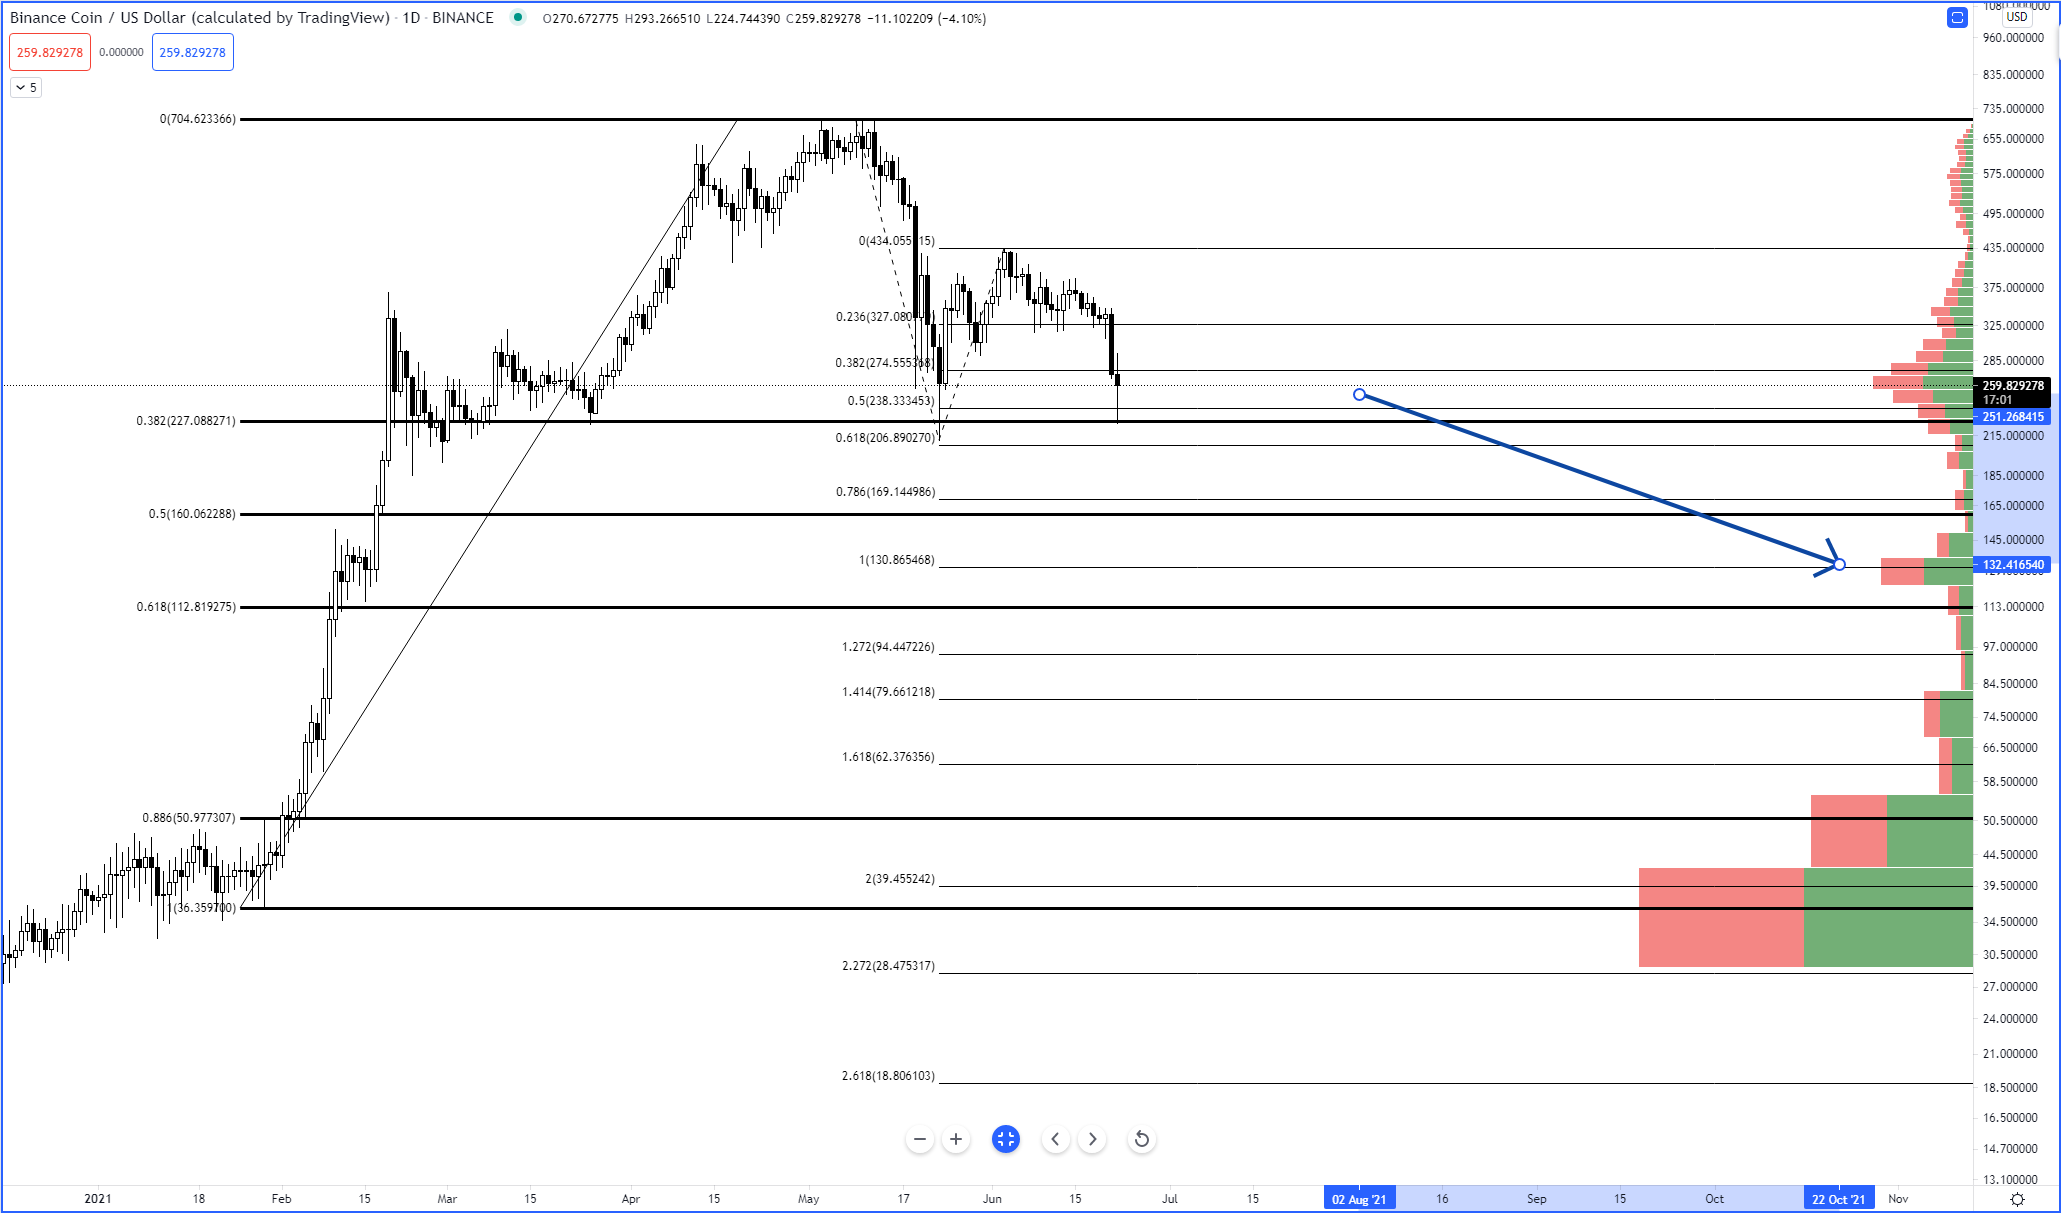
Above: Binance Coin (BNBUSD) Chart
Binance Coin has had one hell of an impressive bounce during the broader crypto sell off. Binance Coin tagged the 38.2% Fibonacci Retracement earlier in the trading day and found support against that level and returned to high volume node at 259. To me, Binance Coin looks more like a laggard here than a leader. In other words, I don’t look at this price action as an indication of strength. I see Binance Coin catching up with the kind of selling pressure the rest of the cryptocurrency market has been experiencing. The blue arrow on the chart points to the 132.41 price level. 132.41 is a high volume node as well as the 100% Fibonacci Extension of the current primary swing. This level is also between the 50% and 61.8% Fibonacci Retracements. It’s not a certainty that Binance Coin will push lower, but I do see it as a very likely event.
Cardano (ADA)

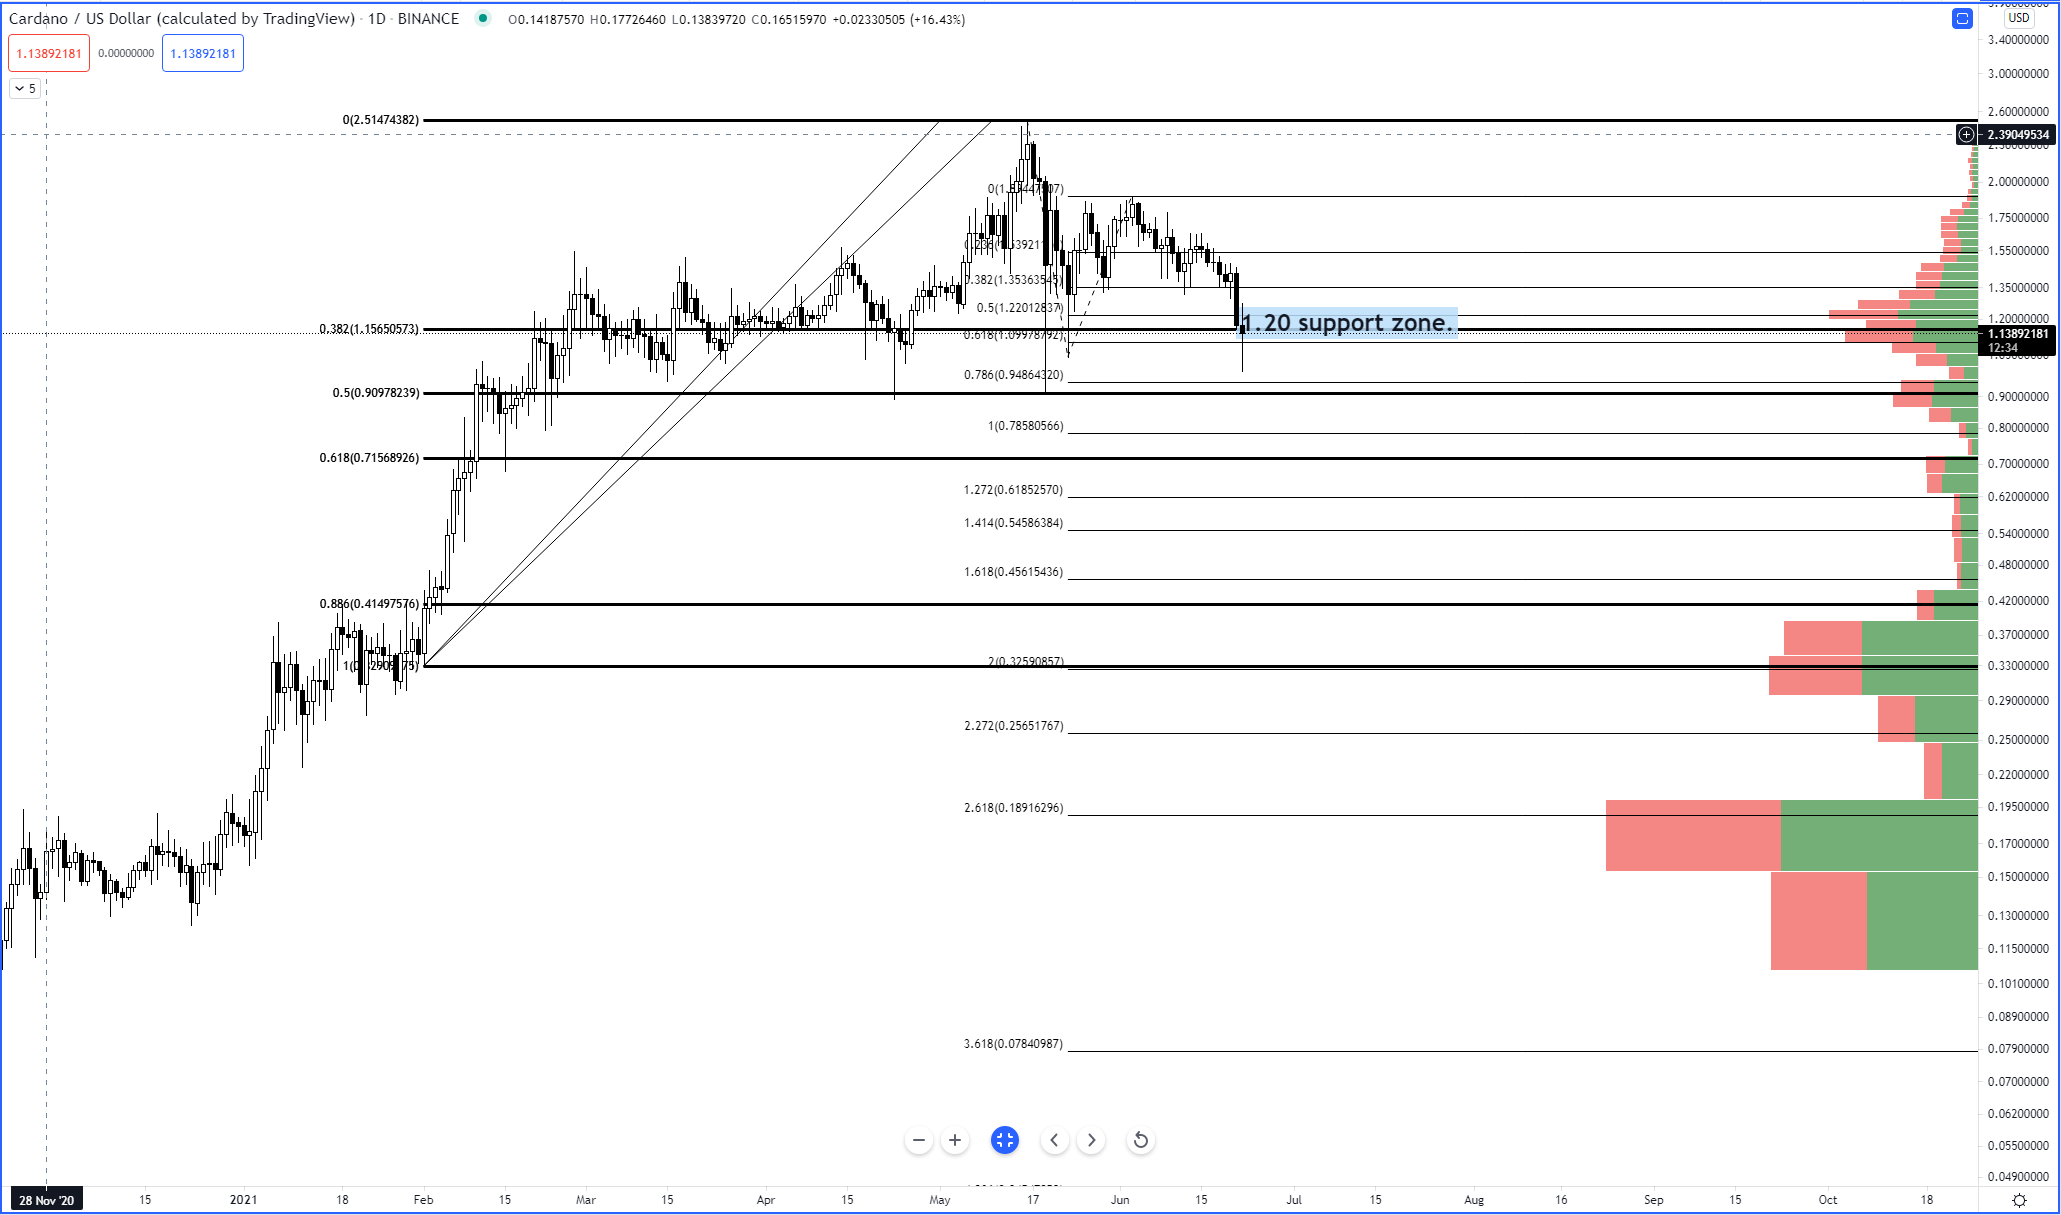
Above: Cardano (ADAUSD) Chart
Cardano’s response to the earlier selling looks a lot like Binance Coin’s response. Does the shared behavior have something to do with their high market cap valuations? I’m not sure – but it’s something to think about. Anyway. Cardano did push down below the $1.00 to hit $0.98 before promptly moving higher. Cardano got very, very close the next support level below $1.20 at the $0.84-$0.94 zone – some might even consider the low of the day to be considered a test of the $0.84-$0.94 range. Personally, I’d like to see Cardano push south towards the $0.90 level to test the $0.84-$0.94 zone as well as the 50% Fibonacci Retracement level. Below that, I see a retest of the next high volume node and 61.8% Fibonacci Extension at $0.71. And if God really wants to throw a gift at me this year to make up for last year, then He’ll allow for Cardano to drop to the 200% Fibonacci Extension and Volume Point of Control at 0.185 – but I don’t think you or I will get that blessed or lucky.
Advertisement
Save money on your currency transfers with TorFX, voted International Money Transfer Provider of the Year 2016 – 2020. Their goal is to connect clients with ultra competitive exchange rates and a uniquely dedicated service whether they choose to trade online or over the telephone.
Find out more here.