
- Litecoin token underperforming with falling volume and still sustaining below all vital moving averages
- The crypto asset is trading below all necessary moving averages of 20, 50, 100 and 200-Day, while Bears seem overpowering Bulls
- The pair of LTC/BTC is trading with intraday gains of +2.11%, standing at 0.004945 BTC; whereas, LTC/ETH is CMP at 0.06556 ETH gains nearly +0.48%
Litecoin token is trading sideways with no significant momentum and falls below the essential moving average of 200-day. Similarly, the volume also continuously declining and dropped below the average line. Again, if the Bulls push the coin above 200-DMA, a good recovery is soon expected. A 20-day short term moving average can act as a bit of a huddle for the digital asset.
The closing of day candles above 200 and 100-DMA with good volume traction will boost Bulls’ confidence. Likewise, resistance on the higher side is at $210 and $275, while support on the lower levels is at $160 and $140.
Litecoin Token is Trading Within The Range
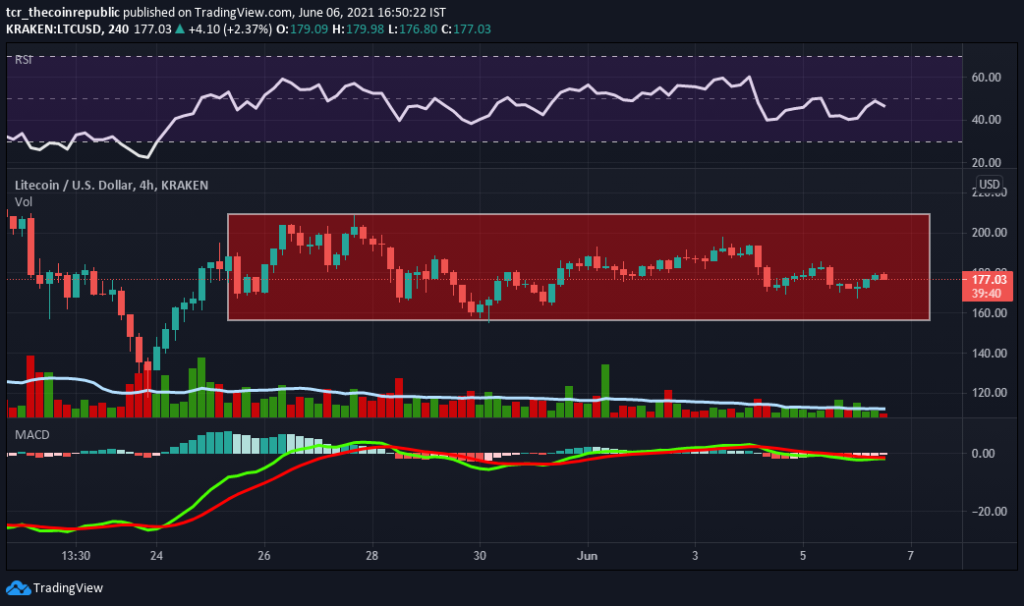
Over the weekly time frame, Litecoin token is trading sideways within the range-bound momentum. In contrast, the range of the coin lies between $210 to $155 as highs and lows, respectively. In comparison, either side breakout will create massive momentum and the range acting as support and resistance. Currently, the Litecoin token is trading at $177 flat with an intraday gain of +0.74% and volume/ market cap ratio standing at 0.2091. Volume in the last 24-hours dropped by -10.24% standing at $2,458,235,283, whereas, total market capitalization remains at $11,826,464,989 with minor intraday gains of +0.74%.
Relative Strength Index (NEUTRAL): Litecoin token RSI is presently projecting sideways momentum over the weekly chart with no sign of any acceleration.
Moving Average Convergence Divergence (MIXED) currently indicates a mixed trend on the daily chart. The buyer’s signal line (green) and the seller’s line (red) overlapping with no clear momentum sign.
Support levels: $210 and $275
Resistance levels: $160 and $140.