- Bitcoin price could head lower since it is approaching a confluence of resistance levels.
- Ethereum price is also considering a downside move as it climbs toward the swing high at $2,910.
- Ripple price seems to have begun its downtrend after tapping the supply zone’s lower limit at $0.986.
Bitcoin price rally that started on May 30 hit a dead end by June 3, which led to a steady downswing. Investors can expect a leg lower as its most recent attempt to head higher will face a stiff resistance barrier.
In such a case, Ethereum price will follow BTC’s footsteps. Ripple price, on the other hand, has already kick-started its downtrend.
The next step in BTC adoption
Despite this bearish outlook that BTC and altcoins exude, a major development took place over the weekend, where El Salvador’s President Nayid Bukele announced that he would propose a bill to the Congress that would make Bitcoin legal tender.
This development came during the Bitcoin 2021 conference held in Miami, Florida.
The move toward adopting Bitcoin comes as prominent economists and authorities mentioned that BTC was too volatile to be considered money or legal tender.
Considering that remittances constitute a significant chunk of El Salvador’s gross domestic product, the proposed policy would set the stage for improving the country’s financial infrastructure. Additionally, if Nayid Bukele’s plans would be approved, it would mark the first major adoption after institutions’ decision to add BTC to their treasuries over the past 12 months.
Bukele further added,
In the short term, this will generate jobs and help provide financial inclusion to thousands outside the formal economy. And in the medium and long term, we hope that this small decision can help us push humanity at least a tiny bit into the right direction.
Although the plans are unclear at this point, there’s a high chance it gets ratified, especially with Bukele’s party named “Nuevas Ideas,” or New Ideas, which resonates with Bitcoin, itself a relatively new idea.
Additionally, the president’s overwhelming success in the recent legislative elections makes it easier to sway the legislature in the bill’s favor.
Bitcoin price to give upswing another try after a brief swing low
Bitcoin price rallied roughly 18% between May 30 and Jun 3, exhausting its bullish momentum. As investors began booking profits, BTC started heading lower and is currently looking to dip into the 4-hour demand zone that extends from $31,111 to $33,900.
This bearish move would result from the confluence of the 50 four-hour and the 100 four-hour Simple Moving Averages (SMA) that are present around $36,775, which coincides with the 50% Fibonacci retracement level.
Therefore, a rejection at this level would lead to a 7% downswing to the said demand zone.
While the short-term scenario is bearish, investors can expect BTC to spring back up after this brief dip.
In such a case, a decisive close above the 50% Fibonacci retracement level at $36,775 will signal the start of an uptrend. If this were to happen, Bitcoin price might continue its ascent toward the resistance barriers at $39,450, $40,841 or the range high at $42,452.
BTC/USDT 4-hour chart
On the flip side, if BTC surges past the confluence at $36,774 and produces a decisive close above $39,450, the bearish thesis will face invalidation.
Under these newly developed circumstances, Bitcoin price could rally to $40,841 or the range high at $42,451.
Ethereum price approaches local top
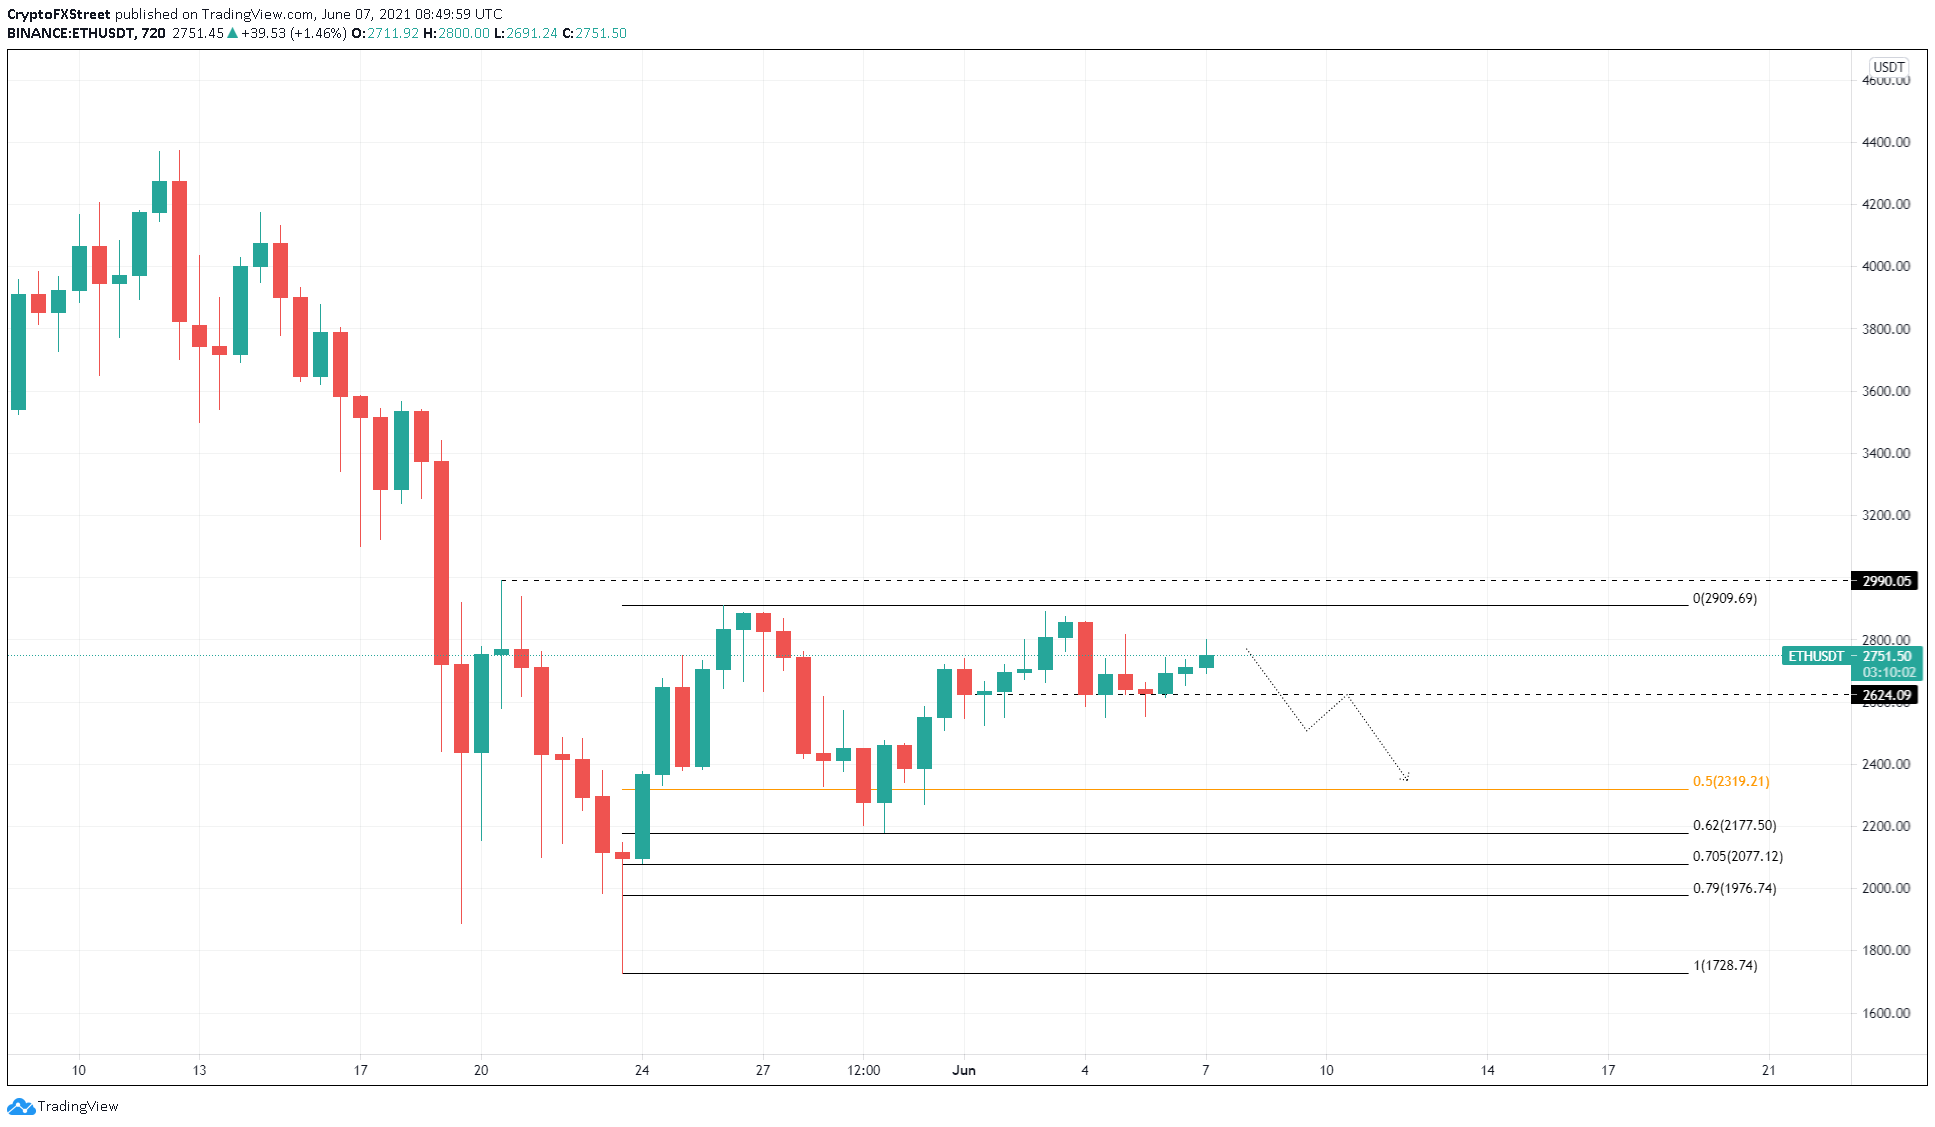
Ethereum price has been more reactive than Bitcoin when it comes to impulse waves. As a result, ETH has set up three swing highs, all in proximity at the range high of $2,910. However, the smart-contract token has never tagged the said level.
Although ETH has rallied 9% over the past day or so, there is a high chance it will not tag the swing high at $2,910.
Even if the bulls manage to push Ethereum price to sweep this high, it is unlikely for this upswing to sustain itself. The primary reason for the bearishness is the correlation of Ether with the flagship cryptocurrency.
Therefore, investors can expect ETH to retest the 50% Fibonacci retracement level at $2,319, roughly a 15% sell-off from the current position.
ETH/USDT 12-hour chart
On the flip side, if Ethereum price manages to sustain above the range high at $2,981, the bearish thesis will face invalidation.
Ripple price kick-starts a down move
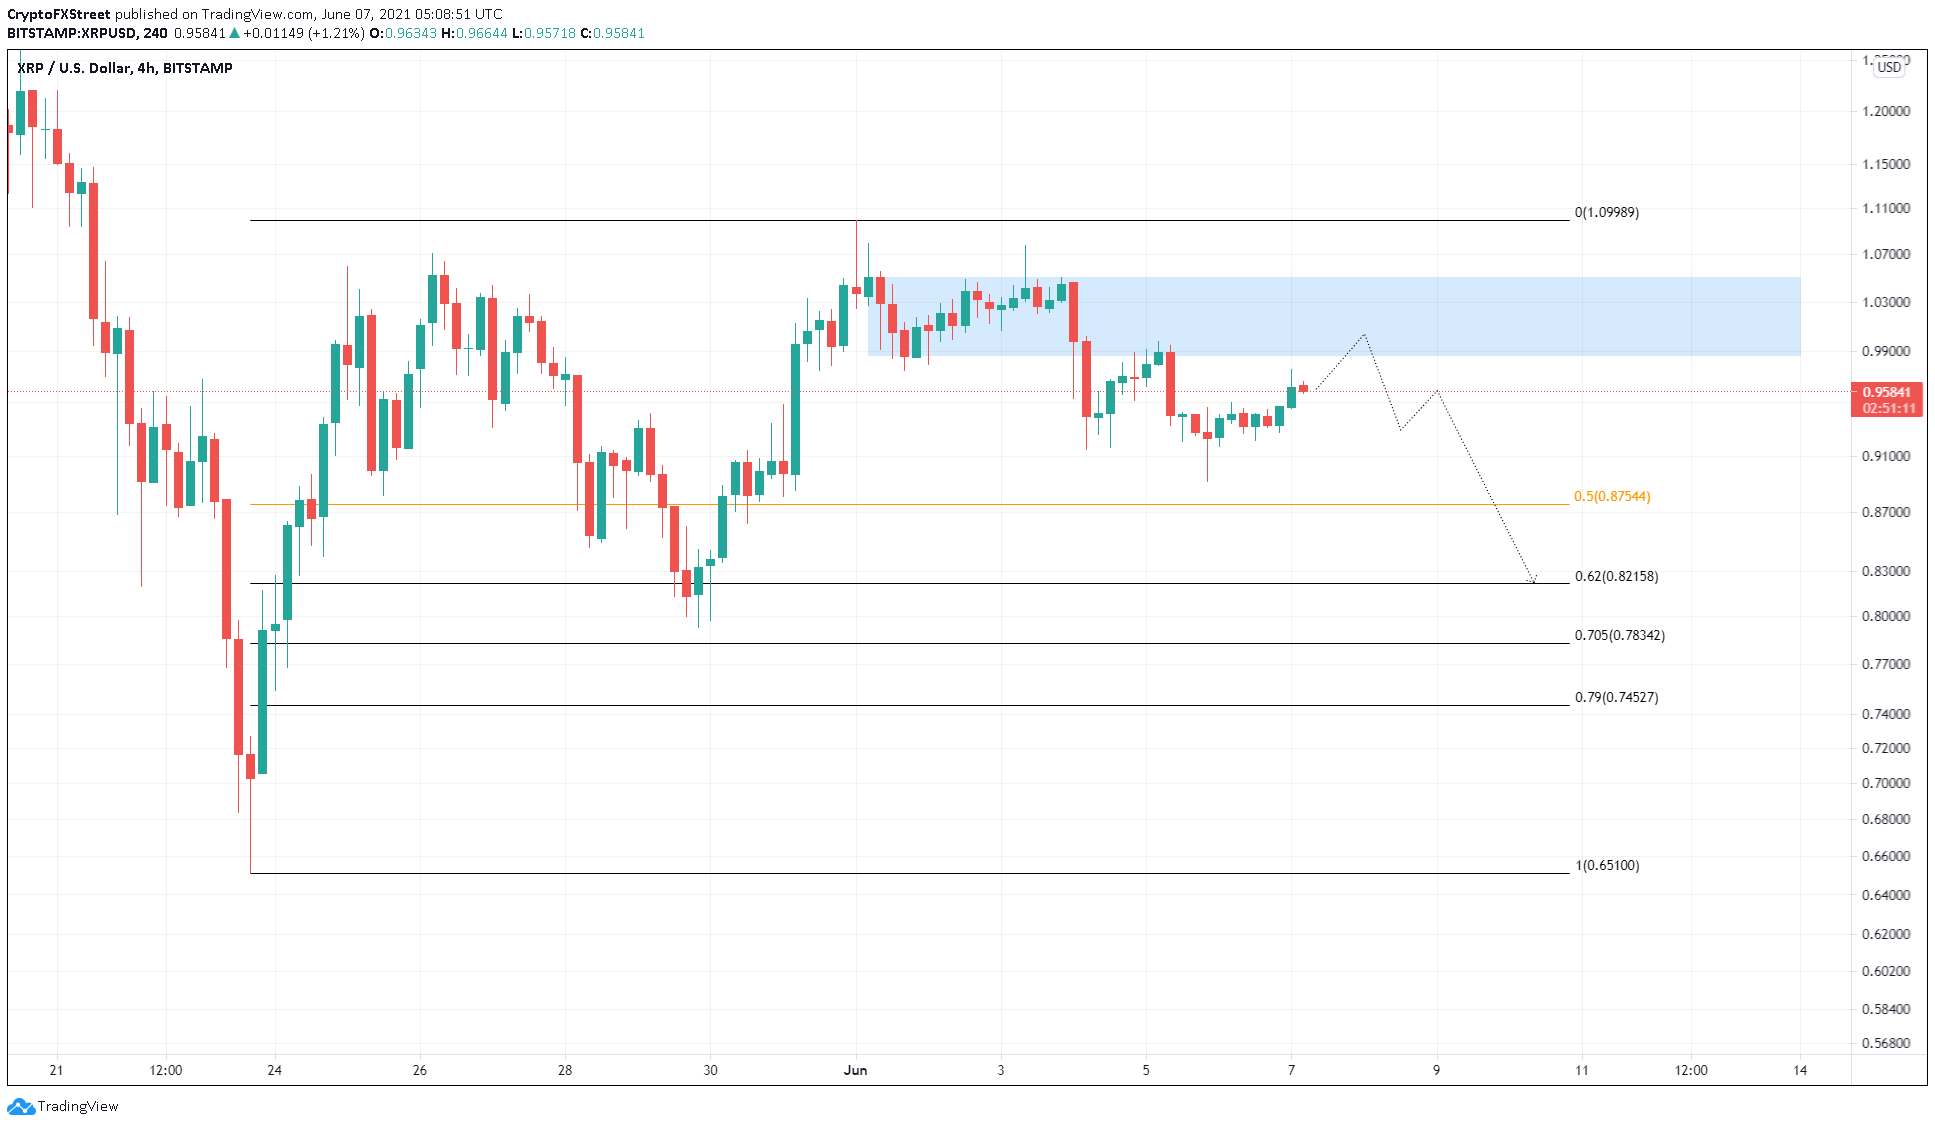
Ripple price made three attempts to breach past the supply zone extending from $0.986 to $1.050 but failed to do so. The most recent jab at an upswing was foiled on June 5 as XRP price faced rejection at $0.986, which has led to a 4% correction to where the remittance is currently trading, $0.958.
Market participants can expect this downswing to continue until it retests $0.875, the midpoint of the range that stretches from $0.745 to $1.10.
Perhaps XRP price might get another sweep at the demand zone’s lower limit at $0.986 before the sell-off begins. Either way, the remittance token is primed for a move lower.
If the ask orders continue to pile up, XRP price might dip to the 62% Fibonacci retracement level at $0.822.
XRP/USDT 4-hour chart
Regardless of the bearishness surrounding Ripple, a potential uptick in buying pressure that slices through $1.05 and produces a four-hour candlestick close above it will invalidate the pessimistic outlook.
In such a case, XRP price could rise by 5% to the range high at $1.10.


