- Bitcoin price has rallied 9% since June 1 and shows promise of continuing this rally.
- Ethereum price is piercing into a supply zone, suggesting a resurgence of buyers.
- Ripple price is following the top two, but its climb is relatively slow.
Bitcoin price seems to be recovering as it heads toward a confluence of critical supply levels. This move comes after an extended consolidation. Unlike BTC, Ethereum price has already rallied into a ceiling and is looking to flip it into a support barrier.
Ripple price is taking its sweet time following the top two, but it is climbing nonetheless.
Bitcoin price to face a make-or-break decision
Bitcoin price has revealed a bullish start to June as it rallied roughly 9% since June 1. This rally could extend up to $46,638 or a 20% upswing from the current position ($38,804).
However, there are two critical resistance levels that inventors need to consider. The first supply barrier is $41,950, which is the peak of the right shoulder. Following this ceiling is the supply zone ranging from $43,000 to $46,638.
While unlikely, if BTC produces a decisive 12-hour candlestick close above $46,638, there is a chance the rally might extend to $49,795.
BTC/USDT 12-hour chart
On the flip side, a breakdown of 34,049 will invalidate the bullish outlook. This move might trigger a 12% sell-off to $30,071.
Ethereum price at an inflection point
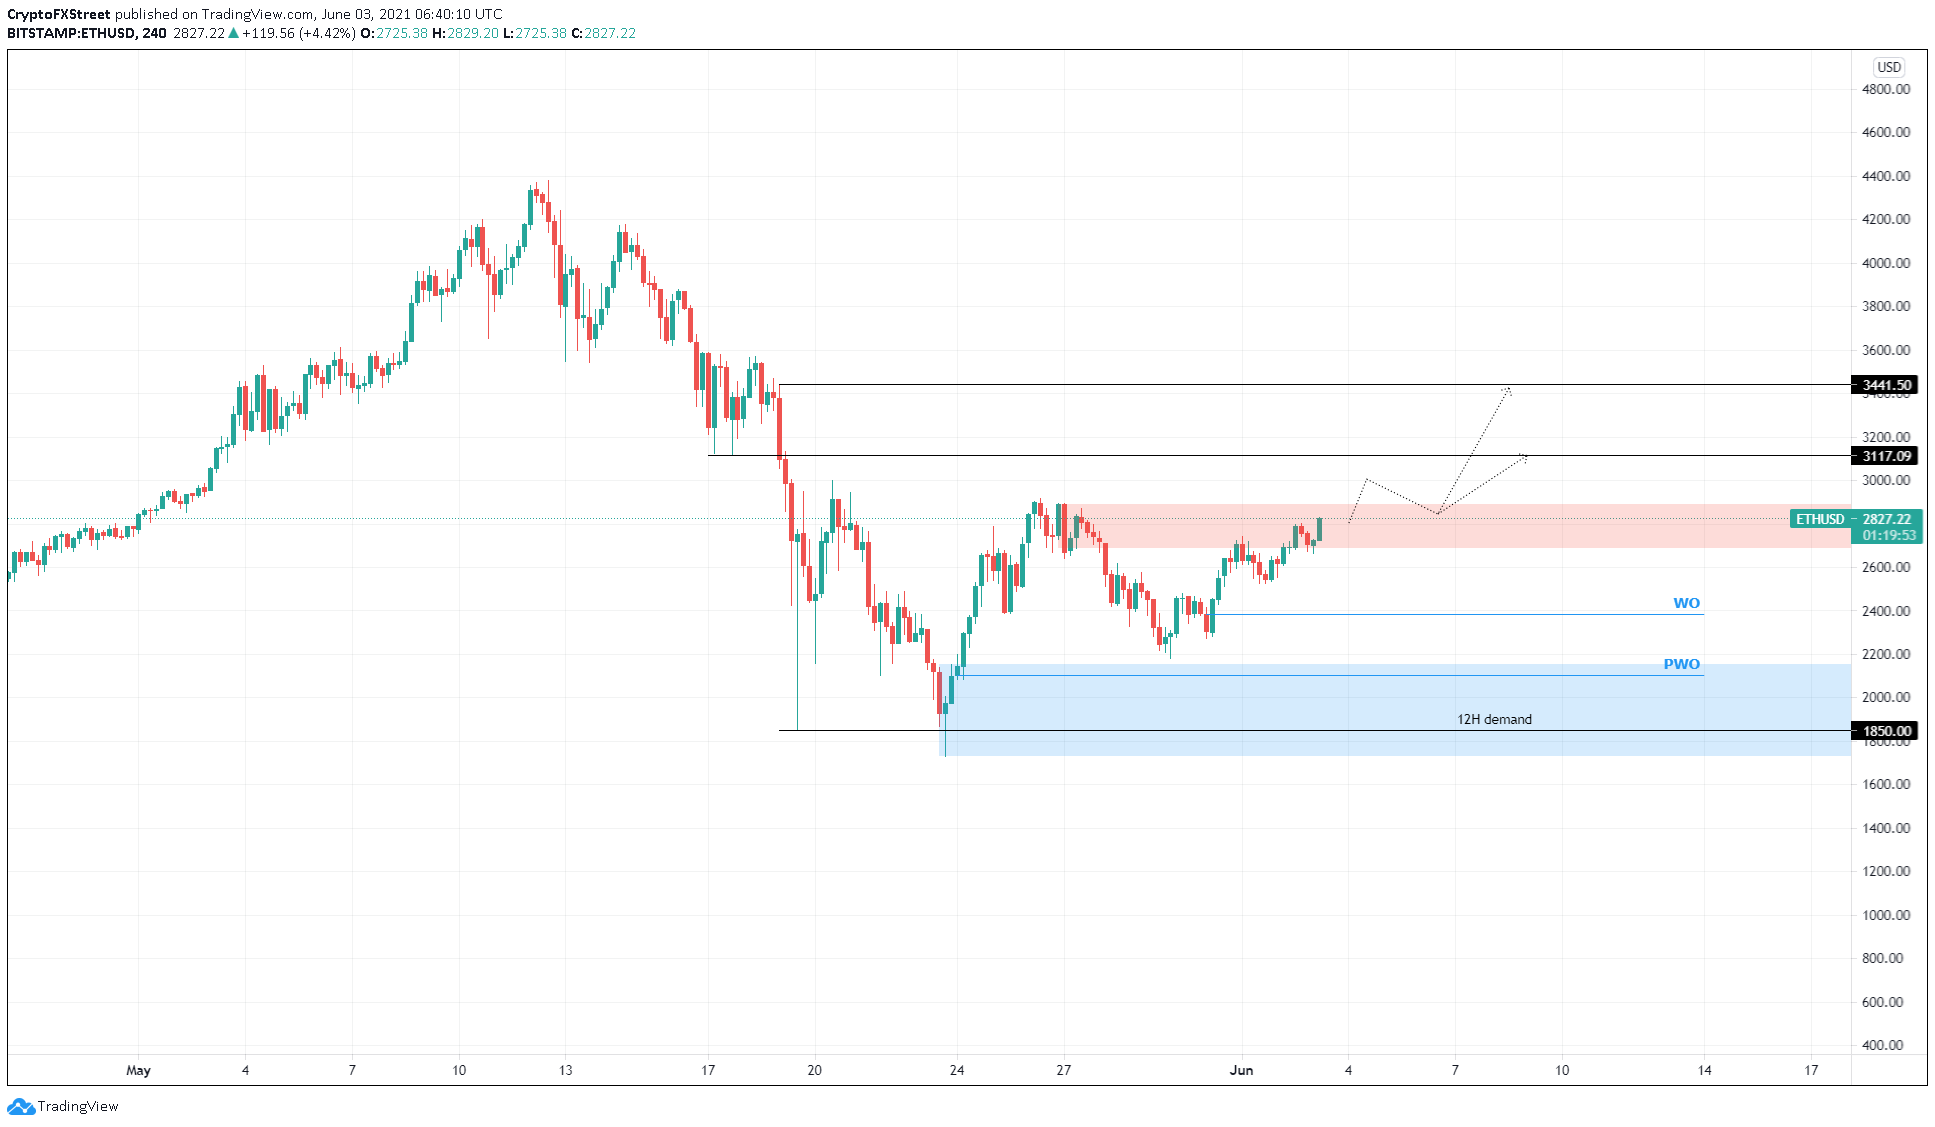
Ethereum price is currently trading inside a supply zone that extends from $2,689 to $2,889 after a 9% rally from June 1. A convincing close above $2,889 will confirm the start of an uptrend.
Under this particular circumstance, investors can expect ETH to rally 11% to $3,117. A breach of the said level could push Ether to $3,441, another 10% rally.
ETH/USD 4-hour chart
Investors should note that a failure to breach past the said supply zone’s upper boundary at $2,889 will signal weak buying pressure and invalidate the potential bullish scenario. In that case, Ethereum price could revisit the weekly open at $2,383, which is a 16% downswing from the current position ($2,827).
If this support is breached, market participants should expect ETH to retest the previous weekly open at $2,101.
Ripple price shows promise
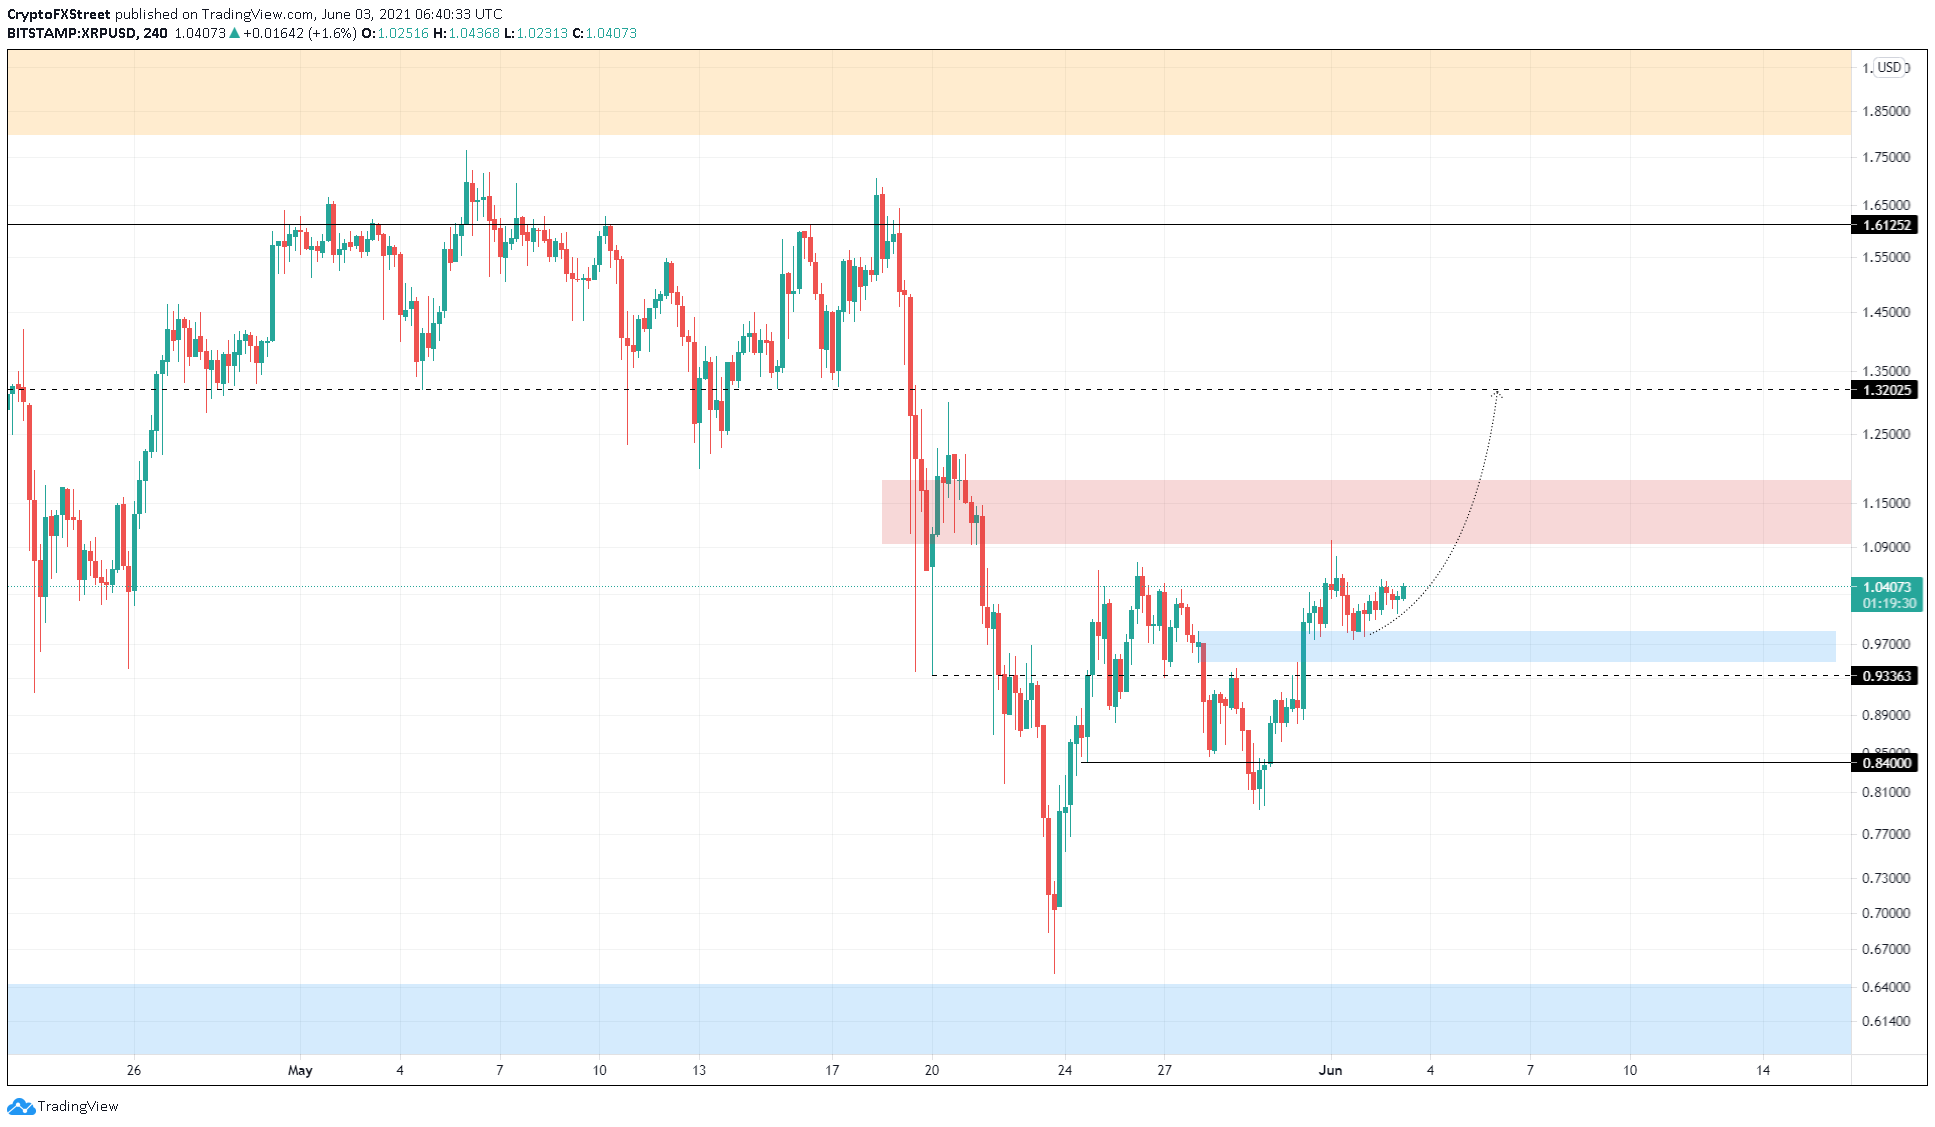
Ripple price has flipped a supply zone ranging from $0.948 to $0.985 into a support zone, suggesting a resurgence of bulls on May 31. Since this shift, XRP price has found support on this floor, indicating the buyers are looking to take Ripple higher.
While this is a bullish sign, a 6% upswing will take XRP price to the following supply area that stretches from $1.094 to $1.183.
If the buying pressure is enough to produce a close above $1.183, it will trigger another 11% run-up to $1.321.
XRP/USD 4-hour chart
While the potential outlook shows promise, if XRP price slides below $0.948, it would signal weak buying pressure. A decisive 4-hour candlestick close below $0.934 will invalidate this bullish outlook and kick-start a 9% downswing to $0.84.


