Litecoin could reach a new ATH above $400, while ADA and XRP both eye $2.00
Cardano, Litecoin, and XRP are all eyeing fresh upsides as most altcoins pump on the back of Ethereum’s breakout to highs of $3,500 and Dogecoin’s sustained run to prices above $0.60.
Ethereum Classic (ETC) and EOS are also pumping hard, with 45% and 34% gains in 24 hours respectively. According to crypto technical analyst Michael Van de Poppe, it’s just a “matter of time” now for other coins like Stellar, NEO and ZRX.
And, old coins are doing well! #Cardano is heating up, #EOS is making a massive breakout, #Litecoin is doing well.
Matter of time until #XRP, #Stellar, #NEO, #ZRX and more are going to follow!
— Michaël van de Poppe (@CryptoMichNL) May 6, 2021
XRP/USD
XRP looks primed for new gains after bulls managed to rebound off the 20-day EMA. With price above the $1.50 line and moving along a bullish trend line, the recovery from lows of $1.03 could continue as the market targets a retest of the $2.00 price level.
The uncertainty suggested by the Doji candle on 6 May suggests some choppiness, but the short-term technical picture seems to favour bulls.
XRP/USD daily chart. Source: TradingView
The Relative Strength Index (RSI) is above the equilibrium point while the Parabolic SAR suggests bullishness with the dotted markers below the price candles.
If the indecision resolves upwards, a clear break above the 0.618 Fib level and the $1.60 line would allow for a potential retest of 14 April intraday high of $1.96. In the short term, a key target lies at the 1.272 Fib level ($2.25).
Contrary to this, a retreat below $1.50 for the pair might see bulls seek to defend gains at the initial support level near the 20-day EMA ($1.42). The main support zone lies near $1.10 if the market flips bearish at this point.
ADA/USD
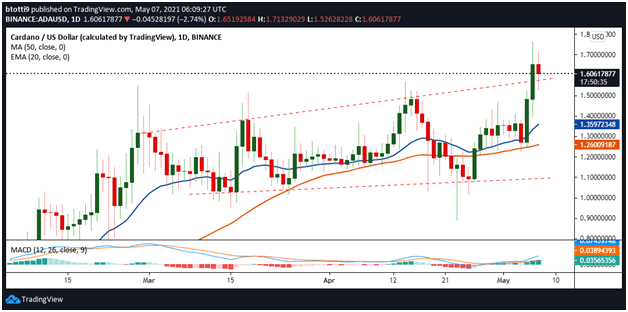
Cardano’s ADA rallied 30% over the last two days to reach an intraday high of $1.76 on May 6.
The daily chart shows the presence of bears after the crypto breached the resistance of a broadening wedge pattern. While there’s the possibility for prices to turn lower, the MACD suggests bulls have the strength to mount an upside assault.
The indicator remains within the bullish zone on the daily chart, with the MACD line increasing above the signal line to highlight the positive outlook for ADA/USD.
If the price turns higher and breaks above $170, bulls might target $2.00. On the downside, failure to stay above the trend line could result in a dip to the 20-day EMA ($1.35) and 50 SMA ($1.25).

ADA/USD daily chart. Source: TradingView
LTC/USD
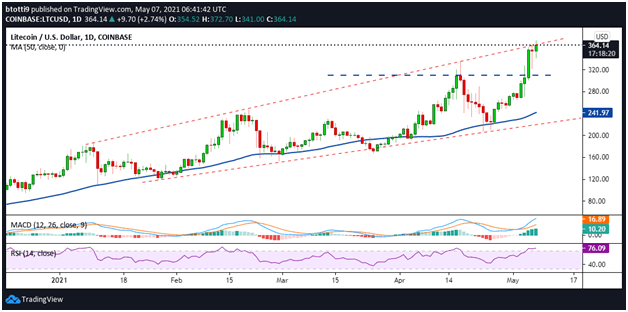
Litecoin has also been trading within an ascending broadening wedge pattern as bulls consolidated gains.
The break above $350 now sets bulls for a retest of the $375 peak reached in December 2017. Although the price flipped off the wedge resistance, a rebound has seen an intraday high formed near $372 on Coinbase.
The MACD and RSI indicators have bulls in control, and that could see the LTC/USD pair rally to $400 or higher this weekend. Prices around $450-$500 are possible.

LTC/USD daily chart. Source: TradingView
If the price begins to decline, initial support is at $309. The 50 SMA ($242) provides a robust demand zone.
